OPEN-SOURCE SCRIPT
SMA Strategy
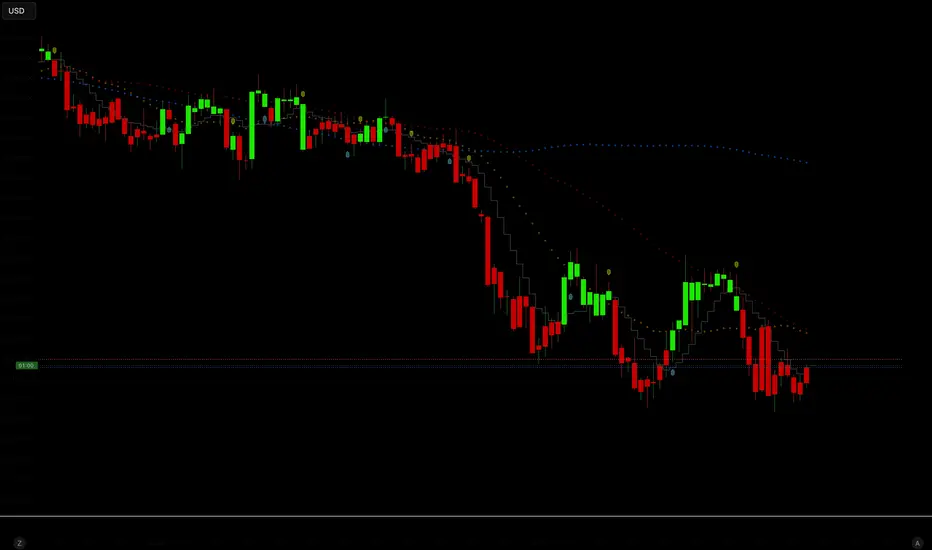
SMA Strategy is a minimalist trend-following trading system built around the interaction of short-term Simple Moving Averages.
The strategy uses the crossover between the SMA 5 and SMA 9 as the primary market trigger, while the SMA 20, SMA 50, and SMA 200 provide additional visual context for short-, medium-, and long-term trend structure.
Core Logic:
A LONG position is opened when the SMA 5 crosses above SMA 9.
A SHORT position is opened when the SMA 5 crosses below SMA 9.
Risk Management
Each trade automatically calculates:
a Stop Loss based on the most recent market structure,
and a Take Profit using a fixed 2:1 risk-to-reward ratio.
For long positions:
Stop Loss = lowest low of the last 5 candles.
Take Profit = entry price + 2× risk.
For short positions:
Stop Loss = highest high of the last 5 candles.
Take Profit = entry price − 2× risk.
This dynamic approach allows the strategy to adapt naturally to changing volatility and price structure.
Visual Features
The script includes multiple visual layers for quick chart interpretation:
SMA 9 displayed as a stepline trigger line.
SMA 20, SMA 50, and SMA 200 plotted as soft circular overlays.
Buy and sell signals plotted directly on the chart.
Candle colors change according to the direction of the SMA 9 trend:
Green candles indicate bullish momentum.
Red candles indicate bearish momentum.
Purpose
The strategy is designed for:
trend continuation trading, short-term momentum detection and clean visual market structure analysis.
Its lightweight construction makes it suitable for discretionary traders, automated backtesting, and further system development.
The strategy uses the crossover between the SMA 5 and SMA 9 as the primary market trigger, while the SMA 20, SMA 50, and SMA 200 provide additional visual context for short-, medium-, and long-term trend structure.
Core Logic:
A LONG position is opened when the SMA 5 crosses above SMA 9.
A SHORT position is opened when the SMA 5 crosses below SMA 9.
Risk Management
Each trade automatically calculates:
a Stop Loss based on the most recent market structure,
and a Take Profit using a fixed 2:1 risk-to-reward ratio.
For long positions:
Stop Loss = lowest low of the last 5 candles.
Take Profit = entry price + 2× risk.
For short positions:
Stop Loss = highest high of the last 5 candles.
Take Profit = entry price − 2× risk.
This dynamic approach allows the strategy to adapt naturally to changing volatility and price structure.
Visual Features
The script includes multiple visual layers for quick chart interpretation:
SMA 9 displayed as a stepline trigger line.
SMA 20, SMA 50, and SMA 200 plotted as soft circular overlays.
Buy and sell signals plotted directly on the chart.
Candle colors change according to the direction of the SMA 9 trend:
Green candles indicate bullish momentum.
Red candles indicate bearish momentum.
Purpose
The strategy is designed for:
trend continuation trading, short-term momentum detection and clean visual market structure analysis.
Its lightweight construction makes it suitable for discretionary traders, automated backtesting, and further system development.
開源腳本
秉持TradingView一貫精神,這個腳本的創作者將其設為開源,以便交易者檢視並驗證其功能。向作者致敬!您可以免費使用此腳本,但請注意,重新發佈代碼需遵守我們的社群規範。

免責聲明
這些資訊和出版物並非旨在提供,也不構成TradingView提供或認可的任何形式的財務、投資、交易或其他類型的建議或推薦。請閱讀使用條款以了解更多資訊。
開源腳本
秉持TradingView一貫精神,這個腳本的創作者將其設為開源,以便交易者檢視並驗證其功能。向作者致敬!您可以免費使用此腳本,但請注意,重新發佈代碼需遵守我們的社群規範。
免責聲明
這些資訊和出版物並非旨在提供,也不構成TradingView提供或認可的任何形式的財務、投資、交易或其他類型的建議或推薦。請閱讀使用條款以了解更多資訊。