OPEN-SOURCE SCRIPT
已更新 Oversold Master
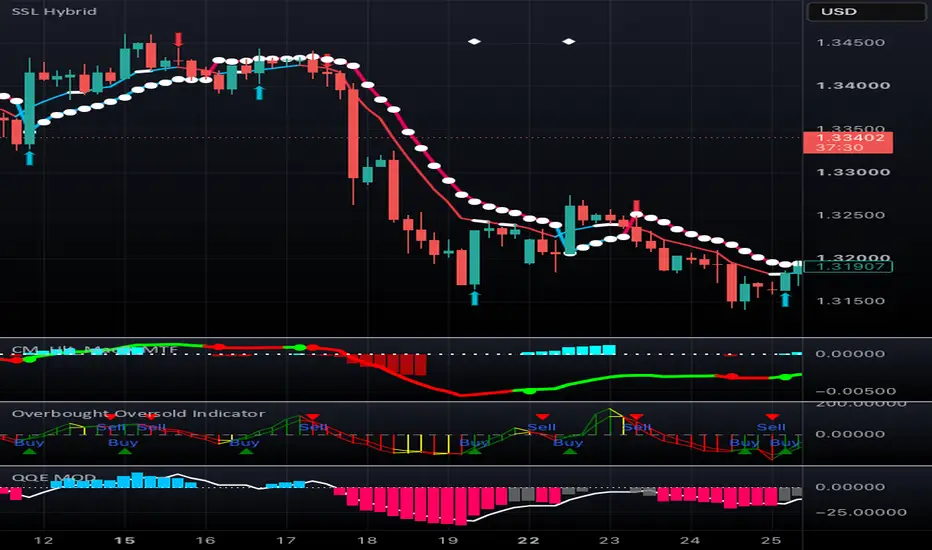
How it works, and how to tune it:
Gray line = neutral. Red = in overbought zone. Blue = in oversold zone.
A triangle signal only appears after price has confirmed its way back out of the zone (controlled by "Bars to Confirm Exit From Zone") — this is what prevents you from selling into a strong momentum spike that keeps climbing.
The bands themselves move (adaptive mode) — during high volatility they widen, so you don't get an overbought signal every 20 minutes; during quiet chop they tighten, so you still catch real extremes.
The trend filter checks a daily EMA by default — it will block sell signals while the daily trend is up, and block buy signals while the daily trend is down. This is the setting most responsible for avoiding "buying a dip that's actually the start of a crash."
Gray line = neutral. Red = in overbought zone. Blue = in oversold zone.
A triangle signal only appears after price has confirmed its way back out of the zone (controlled by "Bars to Confirm Exit From Zone") — this is what prevents you from selling into a strong momentum spike that keeps climbing.
The bands themselves move (adaptive mode) — during high volatility they widen, so you don't get an overbought signal every 20 minutes; during quiet chop they tighten, so you still catch real extremes.
The trend filter checks a daily EMA by default — it will block sell signals while the daily trend is up, and block buy signals while the daily trend is down. This is the setting most responsible for avoiding "buying a dip that's actually the start of a crash."
發行說明
How it works, and how to tune it:Gray line = neutral. Red = in overbought zone. Blue = in oversold zone.
A triangle signal only appears after price has confirmed its way back out of the zone (controlled by "Bars to Confirm Exit From Zone") — this is what prevents you from selling into a strong momentum spike that keeps climbing.
The bands themselves move (adaptive mode) — during high volatility they widen, so you don't get an overbought signal every 20 minutes; during quiet chop they tighten, so you still catch real extremes.
The trend filter checks a daily EMA by default — it will block sell signals while the daily trend is up, and block buy signals while the daily trend is down. This is the setting most responsible for avoiding "buying a dip that's actually the start of a crash."
開源腳本
秉持TradingView一貫精神,這個腳本的創作者將其設為開源,以便交易者檢視並驗證其功能。向作者致敬!您可以免費使用此腳本,但請注意,重新發佈代碼需遵守我們的社群規範。

免責聲明
這些資訊和出版物並非旨在提供,也不構成TradingView提供或認可的任何形式的財務、投資、交易或其他類型的建議或推薦。請閱讀使用條款以了解更多資訊。
免責聲明
這些資訊和出版物並非旨在提供,也不構成TradingView提供或認可的任何形式的財務、投資、交易或其他類型的建議或推薦。請閱讀使用條款以了解更多資訊。