已更新
COVID-19: Daily change per capita (EU only)
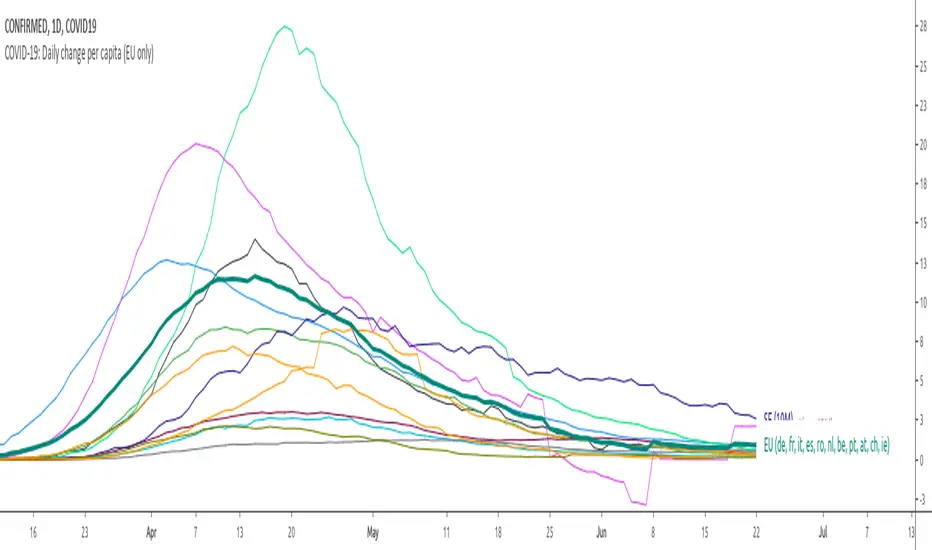
New confirmed cases per day (daily change) is one thing, just an absolute value but when we put this number in context of population (per million people) of each country the situation is a bit different.
We can easily see that, at the moment (Apr 2nd, 2020), the most affected country is Spain (~150 new cases per million people per day) and surprisingly the second one is Switzerland (CH). We can also see Spain or Belgium's steep curve relative to other countries.
I know that some countries run more tests than the others and the outcome might not be reflect the reality but this is the official data that is available.
We can easily see that, at the moment (Apr 2nd, 2020), the most affected country is Spain (~150 new cases per million people per day) and surprisingly the second one is Switzerland (CH). We can also see Spain or Belgium's steep curve relative to other countries.
I know that some countries run more tests than the others and the outcome might not be reflect the reality but this is the official data that is available.
發行說明
# Changelog## 0.0.2 - 20200405
### Added
- Portugal - with more than 10k total cases
- add deaths graphs - toggle between confirmed / deaths graphs in Settings
### Changed
- per capita calculation
- dynamic/relative positioning for legend
- population info for each country
發行說明
Add Sweden (SE) with more than 10k cases and 1k deaths.發行說明
Adding Ireland - IE with more than 1k deaths, fix EU per capita calculation發行說明
Remove COVID19 prefix
免責聲明
這些資訊和出版物並非旨在提供,也不構成TradingView提供或認可的任何形式的財務、投資、交易或其他類型的建議或推薦。請閱讀使用條款以了解更多資訊。