Level: 2
Background
John F. Ehlers introuced SwamiCharts RSI in his "Cycle Analytics for Traders" chapter 16 on 2013.
Function
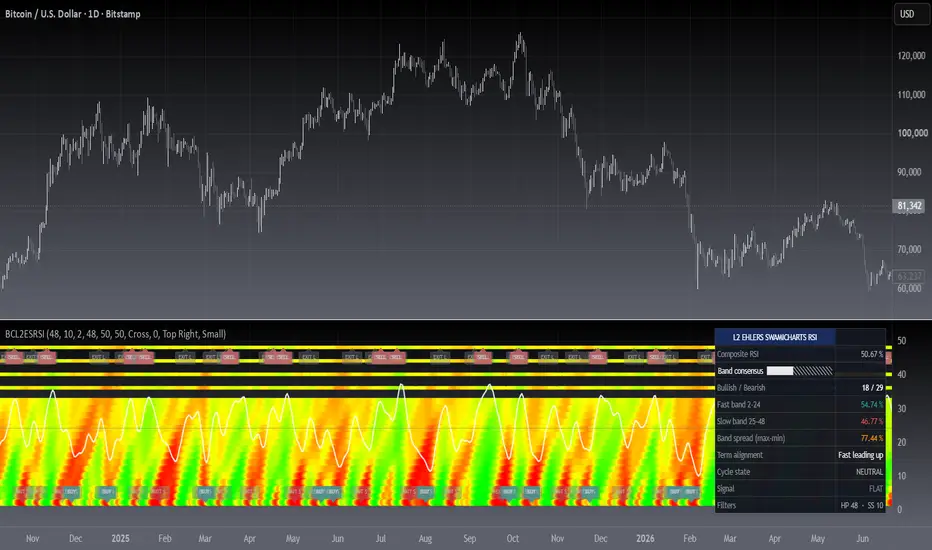
SwamiCharts retain the core functionality of the technical indicators with which you're already familiar, while packing much more information into an easy-to interpret heat map chart. With SwamiCharts, you now visualize each indicator over a range of lookback periods
to reveal a better view of the indicator's truer meaning in context. SwamiCharts provide a better solution because you can now visualize context over a wide range of lookback periods. Trends and cycles emerge more succinctly, while continuation patterns and reversals become
easier to identify. SwamiCharts solves the data lookback problem by enabling you to view market conditions at a glance, a feature that will dramatically facilitate your trading.
Since the MyRSI is computed for all values over the range of lookback periods, it must be an array in Pine v4.0 rather than a variable. The RSI is computed relative to the output of the roofing filter rather than price closes to eliminate the effects of Spectral Dilation. After the computation of the ratio, the indicator is smoothed in a SuperSmoother filter, so we must create the three most recent instances ourselves in the code. This is because Pine v4.0 retains historical values for variables but not for arrays. In fact, ratio must be an array also for the same reasons. The coefficients for the 10-bar SuperSmoother filter are computed and are the same for all lookback periods, and so can be outside the lookback loop to make the calculations a little more efficient.
Key Signal
MyRSI1 --> Modified RSI by John Ehlers
Pros and Cons
100% John F. Ehlers definition translation, even variable names are the same. This help readers who would like to use pine to read his book.
Remarks
The 62th script for Blackcat1402 John F. Ehlers Week publication.
Readme
In real life, I am a prolific inventor. I have successfully applied for more than 60 international and regional patents in the past 12 years. But in the past two years or so, I have tried to transfer my creativity to the development of trading strategies. Tradingview is the ideal platform for me. I am selecting and contributing some of the hundreds of scripts to publish in Tradingview community. Welcome everyone to interact with me to discuss these interesting pine scripts.
The scripts posted are categorized into 5 levels according to my efforts or manhours put into these works.
Level 1 : interesting script snippets or distinctive improvement from classic indicators or strategy. Level 1 scripts can usually appear in more complex indicators as a function module or element.
Level 2 : composite indicator/strategy. By selecting or combining several independent or dependent functions or sub indicators in proper way, the composite script exhibits a resonance phenomenon which can filter out noise or fake trading signal to enhance trading confidence level.
Level 3 : comprehensive indicator/strategy. They are simple trading systems based on my strategies. They are commonly containing several or all of entry signal, close signal, stop loss, take profit, re-entry, risk management, and position sizing techniques. Even some interesting fundamental and mass psychological aspects are incorporated.
Level 4 : script snippets or functions that do not disclose source code. Interesting element that can reveal market laws and work as raw material for indicators and strategies. If you find Level 1~2 scripts are helpful, Level 4 is a private version that took me far more efforts to develop.
Level 5 : indicator/strategy that do not disclose source code. private version of Level 3 script with my accumulated script processing skills or a large number of custom functions. I had a private function library built in past two years. Level 5 scripts use many of them to achieve private trading strategy.
Background
John F. Ehlers introuced SwamiCharts RSI in his "Cycle Analytics for Traders" chapter 16 on 2013.
Function
SwamiCharts retain the core functionality of the technical indicators with which you're already familiar, while packing much more information into an easy-to interpret heat map chart. With SwamiCharts, you now visualize each indicator over a range of lookback periods
to reveal a better view of the indicator's truer meaning in context. SwamiCharts provide a better solution because you can now visualize context over a wide range of lookback periods. Trends and cycles emerge more succinctly, while continuation patterns and reversals become
easier to identify. SwamiCharts solves the data lookback problem by enabling you to view market conditions at a glance, a feature that will dramatically facilitate your trading.
Since the MyRSI is computed for all values over the range of lookback periods, it must be an array in Pine v4.0 rather than a variable. The RSI is computed relative to the output of the roofing filter rather than price closes to eliminate the effects of Spectral Dilation. After the computation of the ratio, the indicator is smoothed in a SuperSmoother filter, so we must create the three most recent instances ourselves in the code. This is because Pine v4.0 retains historical values for variables but not for arrays. In fact, ratio must be an array also for the same reasons. The coefficients for the 10-bar SuperSmoother filter are computed and are the same for all lookback periods, and so can be outside the lookback loop to make the calculations a little more efficient.
Key Signal
MyRSI1 --> Modified RSI by John Ehlers
Pros and Cons
100% John F. Ehlers definition translation, even variable names are the same. This help readers who would like to use pine to read his book.
Remarks
The 62th script for Blackcat1402 John F. Ehlers Week publication.
Readme
In real life, I am a prolific inventor. I have successfully applied for more than 60 international and regional patents in the past 12 years. But in the past two years or so, I have tried to transfer my creativity to the development of trading strategies. Tradingview is the ideal platform for me. I am selecting and contributing some of the hundreds of scripts to publish in Tradingview community. Welcome everyone to interact with me to discuss these interesting pine scripts.
The scripts posted are categorized into 5 levels according to my efforts or manhours put into these works.
Level 1 : interesting script snippets or distinctive improvement from classic indicators or strategy. Level 1 scripts can usually appear in more complex indicators as a function module or element.
Level 2 : composite indicator/strategy. By selecting or combining several independent or dependent functions or sub indicators in proper way, the composite script exhibits a resonance phenomenon which can filter out noise or fake trading signal to enhance trading confidence level.
Level 3 : comprehensive indicator/strategy. They are simple trading systems based on my strategies. They are commonly containing several or all of entry signal, close signal, stop loss, take profit, re-entry, risk management, and position sizing techniques. Even some interesting fundamental and mass psychological aspects are incorporated.
Level 4 : script snippets or functions that do not disclose source code. Interesting element that can reveal market laws and work as raw material for indicators and strategies. If you find Level 1~2 scripts are helpful, Level 4 is a private version that took me far more efforts to develop.
Level 5 : indicator/strategy that do not disclose source code. private version of Level 3 script with my accumulated script processing skills or a large number of custom functions. I had a private function library built in past two years. Level 5 scripts use many of them to achieve private trading strategy.
發行說明
This version provides 2 important updates:1. Improve the visual effect of SwamiCharts by using mixed resolution. Use low-resolution drawing when the Lookback value is low, and use high-resolution drawing when the Lookback value is high. This will help expand the scope of Lookback.
2. Many people ask how SwamiCharts determines Entry Points. I demonstrated that the determination of long entry and short entry can be achieved through color threshold control, and the labels are used to prompt in the chart. Since Tradingview has restrictions on the number of labels (saving computing resources), it can only display a limited number of labels. This phenomenon is not caused by the principle of indicators.
發行說明
This version adjusted label size for better visual effects.發行說明
█ OVERVIEWMulti-lookback Ehlers SwamiCharts RSI drawn as a lookback heatmap: 20 RSI bands
sampled across the 2 to 48 bar spectrum are stacked in one pane so you can see
whether the whole cycle spectrum agrees before you act. V2 adds a composite
consensus line, a status table, edge-triggered BUY/SELL labels and four alerts.
█ CONCEPTS
• Price is first highpassed, so cyclic components shorter than the cutoff are
removed, then run through a 2-pole Super Smoother. The RSI therefore measures
cycles instead of tick noise.
• A SwamiCharts RSI is computed for every lookback across the band on that
smoothed series, and each result is smoothed again with the same 2-pole filter.
• Each band is painted on a red → yellow → green ramp: red means that lookback
sits below 0.50, green means it sits above 0.50.
• A signal is only allowed when the entire band stands on one side of 0.50.
Partial agreement is deliberately ignored — that is the "L2" consensus filter.
█ HOW TO USE
1 — Add it to any symbol and timeframe. The pane axis is measured in lookback
bars, so the top of the pane is the slowest cycle and the bottom the fastest.
2 — Read the stack, not a single band. A solid green stack is a bullish spectrum,
a solid red stack is a bearish spectrum, a mixed stack means no consensus and
you should stand aside.
3 — Take the BUY / SELL markers as the consensus turning point, and the grey
cross as the opposite-consensus exit. Watch the status table for how many
lookbacks actually agree.
Input Parameters
• Highpass Cutoff (48) and SuperSmoother Length (10): Ehlers filter settings.
• Shortest / Longest Lookback (2 / 48): how wide the scanned band is.
• Long Gate / Short Gate (50): how far the saturated band must have curled back
toward 0.50 before the consensus counts.
• Signal Trigger: Cross fires once per state change, State fires on every bar
the state holds.
• Visual toggles: heatmap, transparency, composite line, 50% reference, labels,
markers, exit markers, table position and text size.
█ FEATURES
• 20 stacked lookback bands, sampled from the full 2-48 scan, with adjustable
transparency.
• Composite RSI line scaled onto the band axis, plus a 50% reference line and
green/red shading between them.
• Status table: composite RSI, bullish vs bearish count, consensus bar, fast and
slow band averages, band spread, term alignment, cycle state, live signal.
• Edge-triggered labels only — BUY and EXIT S sit on the 2-bar rail, SELL and
EXIT L on the 48-bar rail. Four alertconditions.
█ SIGNALS
Visual Elements
• BUY: every lookback at or below 0.50 — cycle-wide oversold.
• SELL: every lookback at or above 0.50 — cycle-wide overbought.
• Grey EXIT label: composite RSI crosses 0.50, or the opposite consensus arms.
• Band colour: how far each individual lookback leans.
█ IMPLEMENTATION NOTES
Built on the Ehlers highpass filter and 2-pole Super Smoother Filter; no
request.security and no lookahead, every value uses closed bars only, so nothing
repaints. V2 corrections over the original: the legacy colour lookup table
aliased its brightest green row so fully bullish bands rendered dark green; the
8-bar band carried a duplicated plot title; na values could leak into the RSI
clamp; and labels were re-drawn on every bar a state stayed armed, which flooded
the pane.
█ LIMITATIONS
• Full-band agreement is rare, so signals are infrequent by design.
• The logic is mean-reverting: an oversold spectrum can stay oversold in a
strong trend, so confirm with structure or a higher timeframe.
• The scan is compute-heavy; lower Longest Lookback on slow devices.
█ NOTES
• Method by John F. Ehlers (SwamiCharts); colour-consensus engine by blackcat1402.
• Published under Mozilla Public License 2.0.
═════════════════════════════════════════════════════════════════════════
For questions or feedback, use the comments section below.
Feel free to use and modify — attribution appreciated.

Don't miss out! The first and most important thing to do is to join my Discord chat now! Click here to start your adventure: discord.com/invite/ZTGpQJq My new github for more pine development soon: github.com/wxt-coder
免責聲明
這些資訊和出版物並非旨在提供,也不構成TradingView提供或認可的任何形式的財務、投資、交易或其他類型的建議或推薦。請閱讀使用條款以了解更多資訊。
Don't miss out! The first and most important thing to do is to join my Discord chat now! Click here to start your adventure: discord.com/invite/ZTGpQJq My new github for more pine development soon: github.com/wxt-coder
免責聲明
這些資訊和出版物並非旨在提供,也不構成TradingView提供或認可的任何形式的財務、投資、交易或其他類型的建議或推薦。請閱讀使用條款以了解更多資訊。