已更新
Therlastr Fixed TP Dashboard
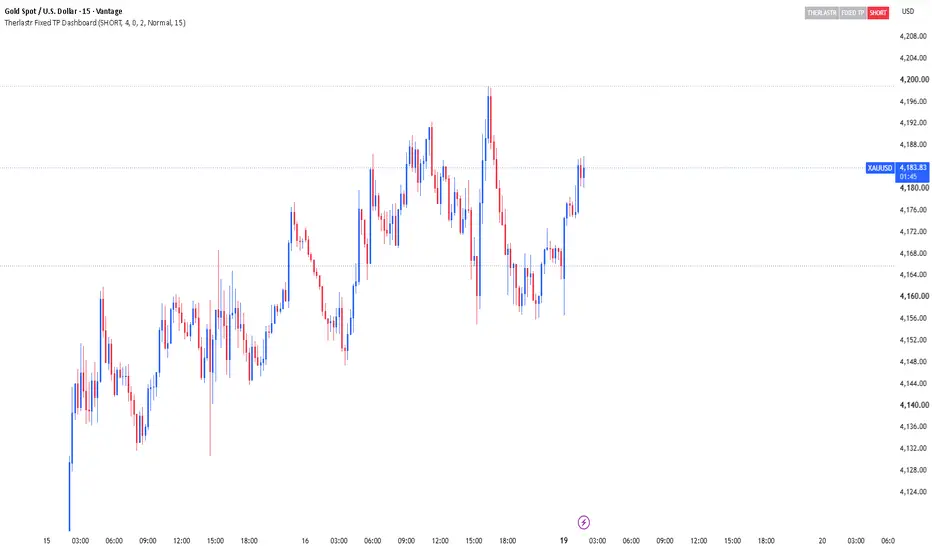
Therlastr Fixed TP Dashboard is a simple, customizable trading tool built to help traders plan and visualize their trade levels directly on the TradingView chart.
You set your trade direction, entry price, stop loss, and fixed take-profit distance, and the dashboard automatically calculates five take-profit targets, shows risk and risk-to-reward ratios, and draws the levels on the chart. It’s designed for better organization, clean visuals, and clear trade planning. Important: this indicator does not open or close trades and does not move your stop loss automatically. All price levels are based on your inputs or calculated from them,
so always use proper risk management and confirm decisions with.
You set your trade direction, entry price, stop loss, and fixed take-profit distance, and the dashboard automatically calculates five take-profit targets, shows risk and risk-to-reward ratios, and draws the levels on the chart. It’s designed for better organization, clean visuals, and clear trade planning. Important: this indicator does not open or close trades and does not move your stop loss automatically. All price levels are based on your inputs or calculated from them,
so always use proper risk management and confirm decisions with.
發行說明
Therlastr Fixed TP Dashboard is a simple, customizable trading tool built to help traders plan and visualize their trade levels directly on the TradingView chart.You set your trade direction, entry price, stop loss, and fixed take-profit distance, and the dashboard automatically calculates five take-profit targets, shows risk and risk-to-reward ratios, and draws the levels on the chart. It’s designed for better organization, clean visuals, and clear trade planning. Important: this indicator does not open or close trades and does not move your stop loss automatically. All price levels are based on your inputs or calculated from them,
so always use proper risk management and confirm decisions with.
發行說明
Therlastr Fixed TP Dashboard is a simple, customizable trading tool built to help traders plan and visualize their trade levels directly on the TradingView chart.You set your trade direction, entry price, stop loss, and fixed take-profit distance, and the dashboard automatically calculates five take-profit targets, shows risk and risk-to-reward ratios, and draws the levels on the chart. It’s designed for better organization, clean visuals, and clear trade planning. Important: this indicator does not open or close trades and does not move your stop loss automatically. All price levels are based on your inputs or calculated from them,
so always use proper risk management and confirm decisions with.

免責聲明
這些資訊和出版物並非旨在提供,也不構成TradingView提供或認可的任何形式的財務、投資、交易或其他類型的建議或推薦。請閱讀使用條款以了解更多資訊。