OPEN-SOURCE SCRIPT
已更新 BKSqueeze
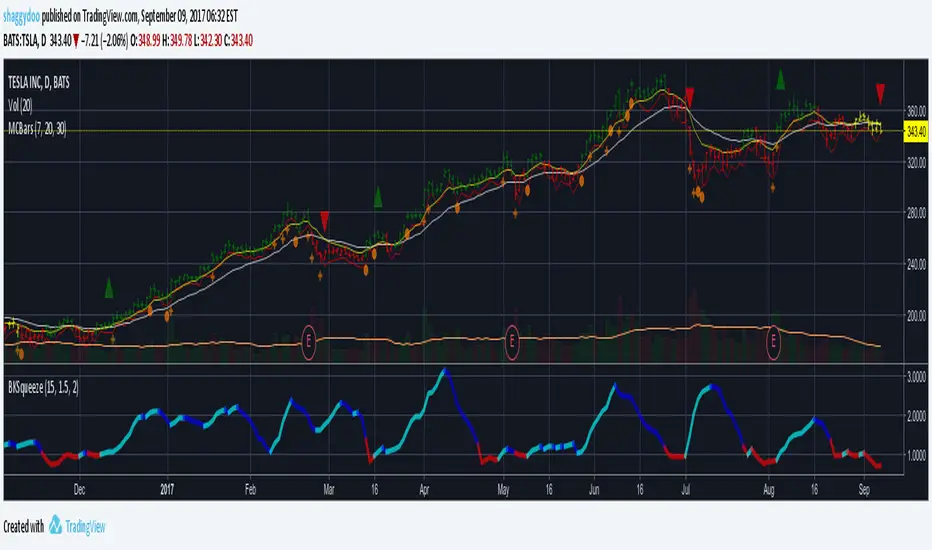
This is a price volatility compression and expansion indicator that uses the ratio of the Bollinger Band and Keltner Ratio.
Red segments indicate extreme price volatility compression that can be ideal entry points for stock/futures/forex and/or options positions.
Aqua segments indicate price volatility is expanding.
Blue segments indicate price volatility is compressing - can be used as an exit point or partial scale out point.
Note that the indicator doesn't indicate direction. One suggestion is to use the DMI indicator for this purpose - really depends on how early you enter the trade.
Suggest using a time period of 15 bars for volatile stocks, such as TSLA for example, otherwise a period of 20 bars suits most stocks/futures/forex symbols.
Red segments indicate extreme price volatility compression that can be ideal entry points for stock/futures/forex and/or options positions.
Aqua segments indicate price volatility is expanding.
Blue segments indicate price volatility is compressing - can be used as an exit point or partial scale out point.
Note that the indicator doesn't indicate direction. One suggestion is to use the DMI indicator for this purpose - really depends on how early you enter the trade.
Suggest using a time period of 15 bars for volatile stocks, such as TSLA for example, otherwise a period of 20 bars suits most stocks/futures/forex symbols.
發行說明
Improved in-squeeze calculation - now works for all symbols including forex發行說明
Updated for consistency發行說明
Overlayed a momentum indicator for direction:Aqua bar indicates uptrend momentum is increasing.
Blue bar indicates uptrend momentum is decreasing.
Red bar indicates downtrend momentum is increasing.
Yellow bar indicates downtrend momentum is decreasing.
Also added early indication of BKRatio squeeze break out:
Orange: BKRatio in squeeze and rising - indicates potential of breakout - early indication to enter prior to breakout.
Red: BKRatio in squeeze and falling or flat - indicates still in squeeze - lower potential of breakout.
Aqua: BKRatio out of squeeze and volatility increasing - initial Aqua segment can be effective entry - depends if using stock, futures or options.
Blue: BKRatio out of squeeze and volatility decreasing - can indicate a potential exit point or scale out point.
開源腳本
秉持TradingView一貫精神,這個腳本的創作者將其設為開源,以便交易者檢視並驗證其功能。向作者致敬!您可以免費使用此腳本,但請注意,重新發佈代碼需遵守我們的社群規範。

免責聲明
這些資訊和出版物並非旨在提供,也不構成TradingView提供或認可的任何形式的財務、投資、交易或其他類型的建議或推薦。請閱讀使用條款以了解更多資訊。
免責聲明
這些資訊和出版物並非旨在提供,也不構成TradingView提供或認可的任何形式的財務、投資、交易或其他類型的建議或推薦。請閱讀使用條款以了解更多資訊。