OPEN-SOURCE SCRIPT
MACD Signal to Zero Distance
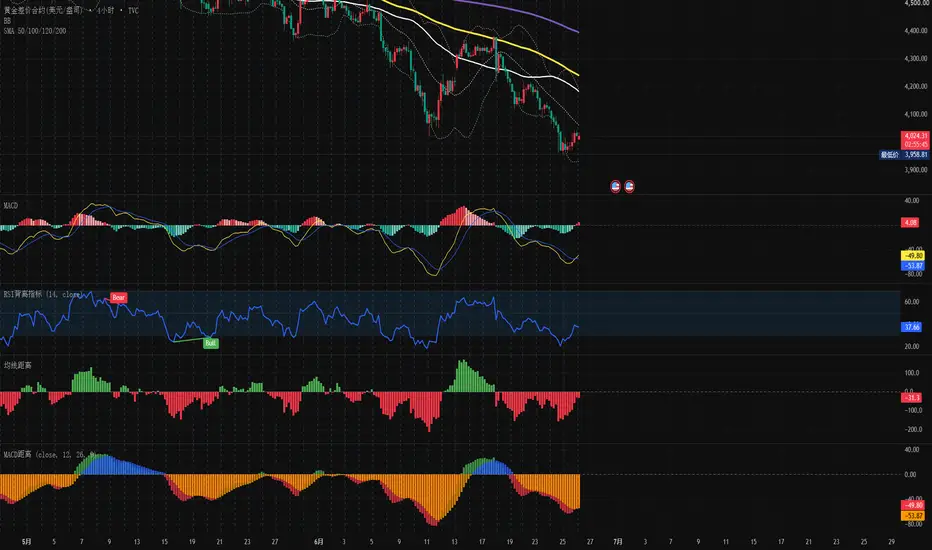
Indicator Overview
The MACD & Signal to Zero Distance indicator is a highly customized momentum space oscillator designed for TradingView. Unlike the traditional MACD, which focuses on the net difference between the fast and slow lines (the standard histogram), this indicator isolates and visualizes the absolute spatial distance of both the MACD Line (Fast Line) and the Signal Line (Slow Line) relative to the Zero Line.
By converting these spatial relationships into color-coded column groups, it provides traders with an instantaneous visual gauge of absolute trend strength, acceleration, and mean-reversion levels.
Core Logic & Data Interpretation
The indicator operates on a linear mapping of spatial distance. When either line sits perfectly on the zero baseline, its distance is 0 (the corresponding column vanishes).
MACD Line to Zero Distance (Fast Component):
Positive Values (Green Columns): Indicate bullish momentum. Higher columns signify that short-term price action has stretched significantly above the long-term baseline.
Negative Values (Red Columns): Indicate bearish momentum. Deeper columns reflect stronger absolute downside expansion.
Signal Line to Zero Distance (Slow Component):
Positive (Blue Columns) / Negative (Orange Columns): Represent the absolute positioning of the medium-term trend. As a moving average of the MACD line, its height relative to the zero axis filters out short-term noise and outlines the structural "margin of safety."
Key Features & Technical Advantages
1. Multi-Source Adaptability
This indicator breaks the constraint of traditional MACD scripts that calculate based solely on the closing price. Traders can seamlessly toggle the Source input to Open, High, Low, or even VWAP (Volume Weighted Average Price). This flexibility makes it highly compatible with Volume Price Analysis (VPA) and intraday anchored trading systems.
2. Clutter-Free Dual Column Design
By rendering two separate, color-distinct bar groups on a shared axis, the script allows traders to identify key market conditions at a glance:
Convergence/Divergence: Whether the fast and slow columns are leveling out or expanding away from each other.
Phase Split: Scenarios where the MACD line has already crossed the zero axis into negative territory while the Signal line remains buffered above it.
3. Precision Mean-Reversion & Trend Monitoring
Since the columns map absolute mathematical distances, they serve as an excellent gauge for:
Baseline Tests: When columns compress near 0, the market is coiled tightly at a fair-value inflection point, offering high-probability breakout or retest entries.
Momentum Exhaustion (Overextension): When columns reach historical peak heights, it signals that the market is overextended relative to its zero baseline, indicating a high probability of a mean-reversion pause or pullback.
核心设计逻辑与数值含义
指标严格遵循“空间距离”的线性映射逻辑,当快慢线完美回归或踩在零轴上时,距离为 0(柱体消失)。
快线离零轴距离(MACD to Zero):
正值(绿色柱体):代表多头动能主导,柱体越高,说明短期价格偏离长期均线的绝对多头空间越大。
负值(红色柱体):代表空头动能主导,柱体越长,说明空头向下发散的绝对动能越强。
慢线离零轴距离(Signal to Zero):
正值(蓝色柱体) / 负值(橙色柱体):代表中线趋势的绝对位置。慢线作为快线的移动平均,其距离零轴的高度反映了趋势的稳定性和“安全边际”。
核心功能与技术优势
1. 多维度价格源支持 (Multi-Source Adaptability)
指标打破了传统 MACD 只能基于收盘价(Close)计算的限制。用户可以在设置中自由切换价格源(如开盘价 Open、最高价 High、最低价 Low)甚至是 VWAP(成交量加权平均价)。这使得指标能够完美融入基于量价分析(Volume Price Analysis)或日内锚定交易的系统。
2. 并排分组视觉设计 (Clarity at a Glance)
通过在零轴上下同时绘制两组独立颜色、相同坐标系的柱状图,交易者可以一眼看出:
快线与慢线是否正在收敛(柱体高度趋于一致)。
快慢线相对于零轴的绝对空间(如:快线已跌破零轴进入负数区,而慢线仍踩在零轴上方保持正数)。
3. 直观的回归交易逻辑 (Mean Reversion & Trend Following)
由于该指标的数值代表绝对距离,交易者可以非常精确地捕捉:
踩线动能:当柱体高度缩减至接近 0(-1 到 +1 之间),代表价格与趋势线完美贴合,是极佳的突破或共振确认点。
动能衰竭(乖离率过大):当绿柱或红柱达到历史极值高度,代表短线动能消耗过大,距离零轴过远,面临向零轴修正(动能衰竭或反弹)的技术需求。
以下は、このカスタムインジケーターの専門的かつ客観的な日本語解説です。
インジケーター概要 (Indicator Overview)
本インジケーターは、TradingView用にカスタマイズされた「MACDモメンタム空間オシレーター」です。従来のMACDが「MACD線とシグナル線の差(ヒストグラム)」に焦点を当てるのに対し、本インジケーターはMACD線(短期線)とシグナル線(長期線)のそれぞれが、ゼロ軸(Zero Line)からどれだけ絶対的な空間距離を置いているかを列状のヒストグラムとしてダイレクトに視覚化します。
これにより、現在の価格モメンタムが位置する絶対的な強弱のゾーンや、ゼロ軸への回帰状態を瞬時に視覚的に把握することが可能になります。
コアロジックと数値の定義
本インジケーターは「空間距離」の線形マッピングロジックに厳格に従っています。各ラインがゼロ軸に完全に張り付いた時、距離は「0」となり、ヒストグラムの柱は消失します。
MACD線のゼロ軸乖離距離(MACD to Zero):
正の値(緑の柱): 強気(ブル)モメンタムが主導。柱が高くなるほど、短期的な価格が長期平均から上方へ大きく乖離していることを示します。
負の値(赤の柱): 弱気(ベア)モメンタムが主導。柱が長くなるほど、下方向への拡散エネルギーが強いことを示します。
シグナル線のゼロ軸乖離距離(Signal to Zero):
正の値(青の柱)/ 負の値(オレンジの柱): 中期トレンドの絶対的な位置。MACD線の移動平均であるシグナル線のゼロ軸からの高さは、トレンドの安定性と「セーフティ・マージン(安全余裕度)」を反映します。
主な機能と技術的メリット
1. マルチ・ソース(価格源)対応 (Multi-Source Adaptability)
従来のMACDが終値(Close)のみに基づいていた制限を排除しました。設定画面から、始値(Open)、高値(High)、安値(Low)、さらにはVWAP(出来高加権平均価格)へ自由に切り替えることができます。これにより、量価分析(ボリューム・プライス・アナリシス)や日中アンカー型取引システムとも完全に融合させることが可能です。
2. 並列グループ化された視覚デザイン (Clarity at a Glance)
ゼロ軸の上下に、色分けされた2つの独立したヒストグラムを同一座標系に描画することで、トレーダーは以下の状態をひと目で判別できます。
MACD線とシグナル線が収束(柱の高さが一致)しつつあるか。
ゼロ軸に対するそれぞれの絶対的フェーズ(例:MACD線はすでにゼロ軸を割り込んで負の領域にあるが、シグナル線は依然としてゼロ軸の上で耐えているなど)。
3. 直感的な平均回帰・トレンドフォロー戦略 (Mean Reversion & Trend Following)
数値が絶対的な「距離」を表すため、以下のような局面を極めて正確に捉えることができます。
ラインへの接地(もみ合いの確認): 柱の高さが0付近に収縮した時は、トレンドラインに価格が完全に収束したことを意味し、ブレイクアウトや共振(レジサポ転換)を狙う絶好のエントリーポイントとなります。
モメンタムの枯渇(過剰乖離): 緑または赤の柱が過去の極値(ピーク)に達した時は、短期的モメンタムが過剰に消費され、ゼロ軸から離れすぎていることを示し、ゼロ軸への回帰(反発や調整)のテクニカルな需要が高まっていると判断できます。
The MACD & Signal to Zero Distance indicator is a highly customized momentum space oscillator designed for TradingView. Unlike the traditional MACD, which focuses on the net difference between the fast and slow lines (the standard histogram), this indicator isolates and visualizes the absolute spatial distance of both the MACD Line (Fast Line) and the Signal Line (Slow Line) relative to the Zero Line.
By converting these spatial relationships into color-coded column groups, it provides traders with an instantaneous visual gauge of absolute trend strength, acceleration, and mean-reversion levels.
Core Logic & Data Interpretation
The indicator operates on a linear mapping of spatial distance. When either line sits perfectly on the zero baseline, its distance is 0 (the corresponding column vanishes).
MACD Line to Zero Distance (Fast Component):
Positive Values (Green Columns): Indicate bullish momentum. Higher columns signify that short-term price action has stretched significantly above the long-term baseline.
Negative Values (Red Columns): Indicate bearish momentum. Deeper columns reflect stronger absolute downside expansion.
Signal Line to Zero Distance (Slow Component):
Positive (Blue Columns) / Negative (Orange Columns): Represent the absolute positioning of the medium-term trend. As a moving average of the MACD line, its height relative to the zero axis filters out short-term noise and outlines the structural "margin of safety."
Key Features & Technical Advantages
1. Multi-Source Adaptability
This indicator breaks the constraint of traditional MACD scripts that calculate based solely on the closing price. Traders can seamlessly toggle the Source input to Open, High, Low, or even VWAP (Volume Weighted Average Price). This flexibility makes it highly compatible with Volume Price Analysis (VPA) and intraday anchored trading systems.
2. Clutter-Free Dual Column Design
By rendering two separate, color-distinct bar groups on a shared axis, the script allows traders to identify key market conditions at a glance:
Convergence/Divergence: Whether the fast and slow columns are leveling out or expanding away from each other.
Phase Split: Scenarios where the MACD line has already crossed the zero axis into negative territory while the Signal line remains buffered above it.
3. Precision Mean-Reversion & Trend Monitoring
Since the columns map absolute mathematical distances, they serve as an excellent gauge for:
Baseline Tests: When columns compress near 0, the market is coiled tightly at a fair-value inflection point, offering high-probability breakout or retest entries.
Momentum Exhaustion (Overextension): When columns reach historical peak heights, it signals that the market is overextended relative to its zero baseline, indicating a high probability of a mean-reversion pause or pullback.
核心设计逻辑与数值含义
指标严格遵循“空间距离”的线性映射逻辑,当快慢线完美回归或踩在零轴上时,距离为 0(柱体消失)。
快线离零轴距离(MACD to Zero):
正值(绿色柱体):代表多头动能主导,柱体越高,说明短期价格偏离长期均线的绝对多头空间越大。
负值(红色柱体):代表空头动能主导,柱体越长,说明空头向下发散的绝对动能越强。
慢线离零轴距离(Signal to Zero):
正值(蓝色柱体) / 负值(橙色柱体):代表中线趋势的绝对位置。慢线作为快线的移动平均,其距离零轴的高度反映了趋势的稳定性和“安全边际”。
核心功能与技术优势
1. 多维度价格源支持 (Multi-Source Adaptability)
指标打破了传统 MACD 只能基于收盘价(Close)计算的限制。用户可以在设置中自由切换价格源(如开盘价 Open、最高价 High、最低价 Low)甚至是 VWAP(成交量加权平均价)。这使得指标能够完美融入基于量价分析(Volume Price Analysis)或日内锚定交易的系统。
2. 并排分组视觉设计 (Clarity at a Glance)
通过在零轴上下同时绘制两组独立颜色、相同坐标系的柱状图,交易者可以一眼看出:
快线与慢线是否正在收敛(柱体高度趋于一致)。
快慢线相对于零轴的绝对空间(如:快线已跌破零轴进入负数区,而慢线仍踩在零轴上方保持正数)。
3. 直观的回归交易逻辑 (Mean Reversion & Trend Following)
由于该指标的数值代表绝对距离,交易者可以非常精确地捕捉:
踩线动能:当柱体高度缩减至接近 0(-1 到 +1 之间),代表价格与趋势线完美贴合,是极佳的突破或共振确认点。
动能衰竭(乖离率过大):当绿柱或红柱达到历史极值高度,代表短线动能消耗过大,距离零轴过远,面临向零轴修正(动能衰竭或反弹)的技术需求。
以下は、このカスタムインジケーターの専門的かつ客観的な日本語解説です。
インジケーター概要 (Indicator Overview)
本インジケーターは、TradingView用にカスタマイズされた「MACDモメンタム空間オシレーター」です。従来のMACDが「MACD線とシグナル線の差(ヒストグラム)」に焦点を当てるのに対し、本インジケーターはMACD線(短期線)とシグナル線(長期線)のそれぞれが、ゼロ軸(Zero Line)からどれだけ絶対的な空間距離を置いているかを列状のヒストグラムとしてダイレクトに視覚化します。
これにより、現在の価格モメンタムが位置する絶対的な強弱のゾーンや、ゼロ軸への回帰状態を瞬時に視覚的に把握することが可能になります。
コアロジックと数値の定義
本インジケーターは「空間距離」の線形マッピングロジックに厳格に従っています。各ラインがゼロ軸に完全に張り付いた時、距離は「0」となり、ヒストグラムの柱は消失します。
MACD線のゼロ軸乖離距離(MACD to Zero):
正の値(緑の柱): 強気(ブル)モメンタムが主導。柱が高くなるほど、短期的な価格が長期平均から上方へ大きく乖離していることを示します。
負の値(赤の柱): 弱気(ベア)モメンタムが主導。柱が長くなるほど、下方向への拡散エネルギーが強いことを示します。
シグナル線のゼロ軸乖離距離(Signal to Zero):
正の値(青の柱)/ 負の値(オレンジの柱): 中期トレンドの絶対的な位置。MACD線の移動平均であるシグナル線のゼロ軸からの高さは、トレンドの安定性と「セーフティ・マージン(安全余裕度)」を反映します。
主な機能と技術的メリット
1. マルチ・ソース(価格源)対応 (Multi-Source Adaptability)
従来のMACDが終値(Close)のみに基づいていた制限を排除しました。設定画面から、始値(Open)、高値(High)、安値(Low)、さらにはVWAP(出来高加権平均価格)へ自由に切り替えることができます。これにより、量価分析(ボリューム・プライス・アナリシス)や日中アンカー型取引システムとも完全に融合させることが可能です。
2. 並列グループ化された視覚デザイン (Clarity at a Glance)
ゼロ軸の上下に、色分けされた2つの独立したヒストグラムを同一座標系に描画することで、トレーダーは以下の状態をひと目で判別できます。
MACD線とシグナル線が収束(柱の高さが一致)しつつあるか。
ゼロ軸に対するそれぞれの絶対的フェーズ(例:MACD線はすでにゼロ軸を割り込んで負の領域にあるが、シグナル線は依然としてゼロ軸の上で耐えているなど)。
3. 直感的な平均回帰・トレンドフォロー戦略 (Mean Reversion & Trend Following)
数値が絶対的な「距離」を表すため、以下のような局面を極めて正確に捉えることができます。
ラインへの接地(もみ合いの確認): 柱の高さが0付近に収縮した時は、トレンドラインに価格が完全に収束したことを意味し、ブレイクアウトや共振(レジサポ転換)を狙う絶好のエントリーポイントとなります。
モメンタムの枯渇(過剰乖離): 緑または赤の柱が過去の極値(ピーク)に達した時は、短期的モメンタムが過剰に消費され、ゼロ軸から離れすぎていることを示し、ゼロ軸への回帰(反発や調整)のテクニカルな需要が高まっていると判断できます。
開源腳本
秉持TradingView一貫精神,這個腳本的創作者將其設為開源,以便交易者檢視並驗證其功能。向作者致敬!您可以免費使用此腳本,但請注意,重新發佈代碼需遵守我們的社群規範。

免責聲明
這些資訊和出版物並非旨在提供,也不構成TradingView提供或認可的任何形式的財務、投資、交易或其他類型的建議或推薦。請閱讀使用條款以了解更多資訊。
免責聲明
這些資訊和出版物並非旨在提供,也不構成TradingView提供或認可的任何形式的財務、投資、交易或其他類型的建議或推薦。請閱讀使用條款以了解更多資訊。