已更新
2-Day Volume Weighted Average Price
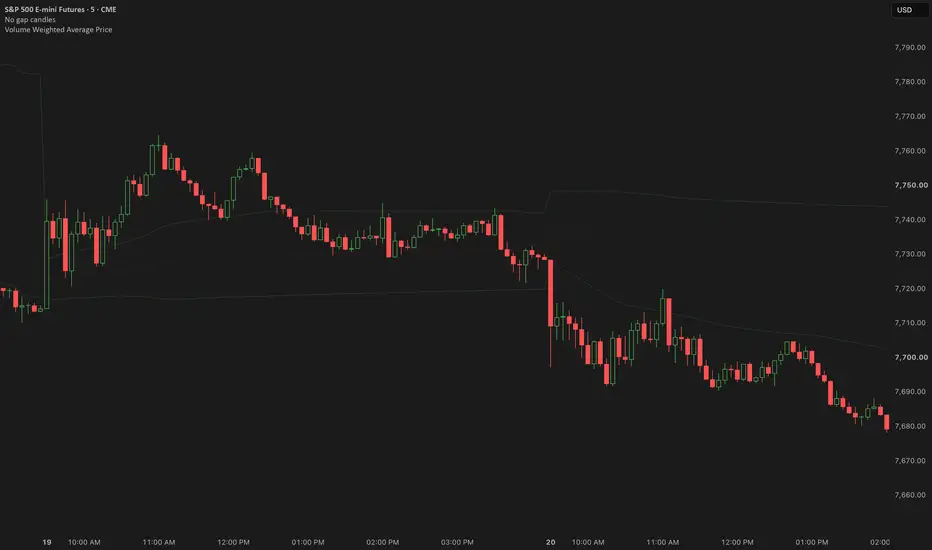
2-Day VWAP (Volume Weighted Average Price)
This script plots a 2-Day Volume Weighted Average Price (VWAP) along with optional deviation bands, designed to give traders a clearer understanding of short-term fair value across multiple sessions. Unlike a standard daily VWAP that resets every session, this version blends the current day with the previous trading day, creating a more stable and context-rich reference point for intraday decision-making.
What This Script Does
At its core, this indicator calculates VWAP using cumulative price and volume data from both the current session and the immediately preceding session. This creates a continuous two-day value area that reflects where the majority of trading activity has occurred across that window.
Instead of resetting fully at the start of each day, the script:
Stores the prior session’s volume and price data
Carries it forward into the current session
Combines both datasets into a unified VWAP calculation
This results in a smoother, more structurally meaningful VWAP that avoids the sharp resets seen in traditional single-day VWAPs.
In addition, the script includes up to three configurable bands, which can be calculated using:
Standard deviation (volatility-based expansion)
Percentage-based distance from VWAP
These bands dynamically adjust based on price behavior and volatility, helping define statistically relevant zones around the VWAP.
Why This Is Useful
Markets do not operate in isolation from one day to the next. A standard VWAP resets daily, which can sometimes remove important context—especially in environments where price is balancing, consolidating, or transitioning between regimes.
The 2-Day VWAP addresses this by:
Preserving short-term memory of the market
Providing a more stable equilibrium level
Reducing noise from abrupt daily resets
Offering a clearer view of whether price is trading at a premium or discount relative to recent activity
This makes it particularly effective in:
Range-bound conditions
Transitional market phases
Intraday execution aligned with slightly higher timeframe context
How to Use It
The 2-Day VWAP is best used as a dynamic reference point for value and positioning, not as a standalone signal.
A common framework for using it:
1. Identify Market Location
When price is above VWAP → market is trading at a premium
When price is below VWAP → market is trading at a discount
When price is near VWAP → market is in balance
2. Observe Reactions at VWAP
The VWAP often acts as an area where:
Buyers and sellers reach temporary agreement
Liquidity concentrates
Rotations or continuations begin
Pay attention to how price behaves when interacting with it:
Clean rejection → continuation away from VWAP
Acceptance (chop around it) → balanced conditions
3. Use Bands for Context
The deviation bands help frame extremes:
Outer bands may indicate stretched conditions
Inner bands can act as intermediate reaction zones
In volatility-based mode, these bands expand and contract naturally with market conditions, making them adaptive rather than fixed.
4. Align With Your Execution Timeframe
This indicator is most effective when used on intraday charts (such as 5m or 15m), where it can guide execution while still incorporating higher timeframe context through its 2-day structure.
Key Advantages
Provides a more continuous and stable VWAP framework
Reduces the “reset effect” of traditional VWAP
Helps identify true short-term value
Adapts to volatility through dynamic band calculations
Works well alongside price action, structure, and other confluence factors
Important Notes
This indicator does not predict future price movement. It is a tool for contextualizing current price relative to recent trading activity.
VWAP-based strategies require discretion, experience, and proper risk management.
Market conditions vary, and no single tool is universally effective in all environments.
Disclaimer
This script is provided for educational and informational purposes only. It does not constitute financial advice, investment advice, or a recommendation to buy or sell any financial instrument. Trading involves risk, and past performance is not indicative of future results. Always conduct your own analysis and consult with a qualified financial professional before making any trading decisions.
If you want, I can tailor this description specifically to your style (like your 5DMA absorption + expansion framework) so it matches your system perfectly.
This script plots a 2-Day Volume Weighted Average Price (VWAP) along with optional deviation bands, designed to give traders a clearer understanding of short-term fair value across multiple sessions. Unlike a standard daily VWAP that resets every session, this version blends the current day with the previous trading day, creating a more stable and context-rich reference point for intraday decision-making.
What This Script Does
At its core, this indicator calculates VWAP using cumulative price and volume data from both the current session and the immediately preceding session. This creates a continuous two-day value area that reflects where the majority of trading activity has occurred across that window.
Instead of resetting fully at the start of each day, the script:
Stores the prior session’s volume and price data
Carries it forward into the current session
Combines both datasets into a unified VWAP calculation
This results in a smoother, more structurally meaningful VWAP that avoids the sharp resets seen in traditional single-day VWAPs.
In addition, the script includes up to three configurable bands, which can be calculated using:
Standard deviation (volatility-based expansion)
Percentage-based distance from VWAP
These bands dynamically adjust based on price behavior and volatility, helping define statistically relevant zones around the VWAP.
Why This Is Useful
Markets do not operate in isolation from one day to the next. A standard VWAP resets daily, which can sometimes remove important context—especially in environments where price is balancing, consolidating, or transitioning between regimes.
The 2-Day VWAP addresses this by:
Preserving short-term memory of the market
Providing a more stable equilibrium level
Reducing noise from abrupt daily resets
Offering a clearer view of whether price is trading at a premium or discount relative to recent activity
This makes it particularly effective in:
Range-bound conditions
Transitional market phases
Intraday execution aligned with slightly higher timeframe context
How to Use It
The 2-Day VWAP is best used as a dynamic reference point for value and positioning, not as a standalone signal.
A common framework for using it:
1. Identify Market Location
When price is above VWAP → market is trading at a premium
When price is below VWAP → market is trading at a discount
When price is near VWAP → market is in balance
2. Observe Reactions at VWAP
The VWAP often acts as an area where:
Buyers and sellers reach temporary agreement
Liquidity concentrates
Rotations or continuations begin
Pay attention to how price behaves when interacting with it:
Clean rejection → continuation away from VWAP
Acceptance (chop around it) → balanced conditions
3. Use Bands for Context
The deviation bands help frame extremes:
Outer bands may indicate stretched conditions
Inner bands can act as intermediate reaction zones
In volatility-based mode, these bands expand and contract naturally with market conditions, making them adaptive rather than fixed.
4. Align With Your Execution Timeframe
This indicator is most effective when used on intraday charts (such as 5m or 15m), where it can guide execution while still incorporating higher timeframe context through its 2-day structure.
Key Advantages
Provides a more continuous and stable VWAP framework
Reduces the “reset effect” of traditional VWAP
Helps identify true short-term value
Adapts to volatility through dynamic band calculations
Works well alongside price action, structure, and other confluence factors
Important Notes
This indicator does not predict future price movement. It is a tool for contextualizing current price relative to recent trading activity.
VWAP-based strategies require discretion, experience, and proper risk management.
Market conditions vary, and no single tool is universally effective in all environments.
Disclaimer
This script is provided for educational and informational purposes only. It does not constitute financial advice, investment advice, or a recommendation to buy or sell any financial instrument. Trading involves risk, and past performance is not indicative of future results. Always conduct your own analysis and consult with a qualified financial professional before making any trading decisions.
If you want, I can tailor this description specifically to your style (like your 5DMA absorption + expansion framework) so it matches your system perfectly.
發行說明
***2D VWAP — Official UpdateThis update resolves an issue where the VWAP was not consistently hidden across all higher timeframes.
Previously, the script only detected specific higher timeframes (1H, Daily, Weekly, Monthly), which caused the VWAP to remain visible on intermediate timeframes such as 2H, 3H, and 4H charts.
The visibility logic has now been fully upgraded to use a time-based calculation rather than fixed timeframe checks. As a result, the VWAP will now correctly hide on all timeframes greater than or equal to 1 hour.
What’s Improved
VWAP now hides on all timeframes ≥ 1 hour (including 2H, 3H, 4H, etc.)
Consistent behavior across all chart resolutions
Cleaner and more robust timeframe detection logic
Improved internal structure for visibility conditions
發行說明
***UPDATE***Updated Short Name
發行說明
***UPDATE***Updated Short Title
發行說明
2-Day Volume Weighted Average Price — Charting UpdateThis update refines the visual presentation and multi-timeframe behavior of the 2-Day VWAP (Volume Weighted Average Price) indicator while preserving its existing calculation methodology.
Update Features
Refined presentation of the 2-Day VWAP and standard-deviation reference levels.
Standard-deviation band fills have been removed to provide a cleaner chart.
VWAP and deviation levels are hidden automatically on 10-minute and higher timeframes.
Existing volume-weighted calculations and 2-day session aggregation remain unchanged.
Standard-deviation levels continue to provide reference points for evaluating price deviation from VWAP.
No trading signals, automated trade execution, performance claims, or predictive functionality have been added.
Purpose
The indicator is designed as a technical analysis and charting tool for traders who use VWAP, volume-weighted price, standard deviation, and intraday market structure as part of their own analysis.
This script is provided for educational and informational purposes only and does not constitute financial, investment, or trading advice. Past performance is not indicative of future results. Trading futures and other leveraged financial products involves substantial risk, including the potential for losses exceeding the amount initially deposited.

免責聲明
這些資訊和出版物並非旨在提供,也不構成TradingView提供或認可的任何形式的財務、投資、交易或其他類型的建議或推薦。請閱讀使用條款以了解更多資訊。
免責聲明
這些資訊和出版物並非旨在提供,也不構成TradingView提供或認可的任何形式的財務、投資、交易或其他類型的建議或推薦。請閱讀使用條款以了解更多資訊。