Stream Master [SimpleAlgo]
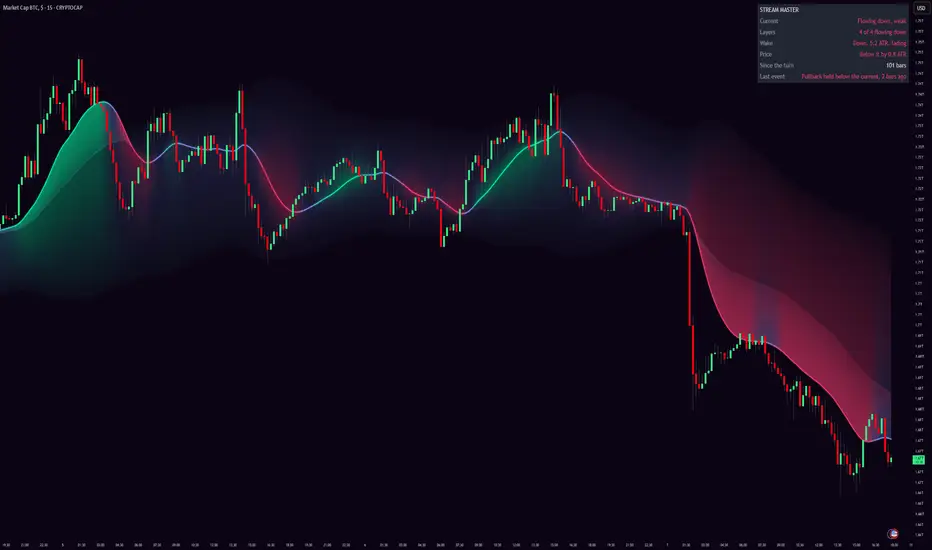
█ INTRODUCING STREAM MASTER
Every trend tool answers the same question, which way is the market going, and most of them answer it with a line that changes colour. The line tells you the direction. It tells you nothing about how hard the market is moving, whether the move is running out, or how far into a turn you are.
Stream Master draws the market as a river. The current is price smoothed twice over 10 bars. Around it, three layers of water follow the current with more and more lag, out to a slow water that follows price smoothed twice over 60 bars. When the market moves, the current runs ahead and the slow water trails behind, and the river leaves a wake: long and bright when the move is fast, gone when the market stalls. Every layer takes the up colour while it is flowing up and the down colour while it is flowing down, so a turn passes through the river from the inside out, and you can see how deep it has gone.

There are no labels on the chart. The shape and colour of the river is the whole read, and the panel in the corner says it in words: which way the current flows and how hard, how many of the four layers have turned, how long the wake is and whether it is growing, stretched, fading or turning, and where price sits relative to the current. The seven moments worth knowing about are alerts.

⚪ The river
Four layers make the river: the current and three edges. Each edge is a blend of the current and the slow water, the first about half way between them, the second most of the way, the third the slow water itself. Each is pushed out by a width that grows with its distance from the current, 35%, 70% and 100% of the river's full width, 3.5 ATRs each side by default. In slack water the river is a smooth band around the current. In a move the inner layers follow the current and the outer layers lag behind it, and the band stretches into a wake. The water is brightest at the current and fades toward the slow water, and the whole river dims when nothing is moving.
⚪ The wake
The wake is the distance between the current and the slow water, measured in ATRs. It is the memory of the move: how far the market has travelled, in its own volatility units, since the slow water last caught up. The script tracks the longest each wake gets, notices when it has started to give that back, and compares it with the last twenty wakes to say whether this move is already longer than the market usually runs.
⚪ What's different
The river is not a ribbon of moving averages. There are only two smoothed series in it, the current and the slow water, and the layers are blends between them, which is why the wake is one shape instead of a stack of lines. Each layer is coloured by its own slope rather than by the current's, so the picture shows how far a turn has spread, and the panel counts it. The wake is treated as a measured quantity with a memory, not just a gap between two lines. And the events are in the river's own vocabulary: the current turning, price leaving the stream and rejoining it, a pullback to the current that holds, the wake stretching, the wake fading.
█ HOW IT WORKS
⚪ 1. The current and the slow water
The current is price smoothed twice, which rounds it without the stepping a single average has. The slow water is the same thing over a much longer length:
Pine Script®
Everything in the river is measured in ATRs, so the same settings mean the same thing on gold, on bitcoin and on a stock:
Pine Script®
⚪ 2. The flow
The current's slope, in ATRs per bar and smoothed over 8 bars, is the flow. A flow of 0.12 ATRs a bar is full colour. Anything inside 15% of that is slack:
Pine Script®
The current flows one way until its slope has crossed the slack zone to the other side. That is the turn, and it is the moment the panel's Since the turn row counts from:
Pine Script®
⚪ 3. The layers
Each edge is a blend of the current and the slow water. The blend is curved, so the first edge sits about half way out, the second most of the way, and the third is the slow water itself:
Pine Script®
The edge is then pushed out by a width that grows with its distance from the current, using a smoothed ATR so the river's width doesn't jump on one big bar:
Pine Script®
⚪ 4. Colour by each layer's own slope
Every edge is coloured by its own slope, smoothed over 12 bars, not by the current's. The first edge is about half current and half slow water, so it turns a few bars after the current. The outer edge is the slow water, so it turns last. That is why a turn passes through the river from the inside out, and why the panel can count how many of the four layers have turned.
Pine Script®
The colour runs from the slack blue to the up or down colour as the slope rises out of the slack zone, so the river brightens smoothly into a move instead of switching on:
Pine Script®
Each layer's colour is held in steps of a tenth, and a step only moves once the slope has travelled a full step, so a fill keeps one colour for a run of bars instead of flickering between two shades while the slope sits on a boundary:
Pine Script®
The six bands between the four layers are gradient fills, each running from the inner layer's colour to the outer layer's, brightest at the current and fading to the slow water. In a wake the outer layer can sit on the far side of the inner one, so each fill is told explicitly which of its two edges is on top.
⚪ 5. The wake, measured
The wake is the distance between the current and the slow water in ATRs, and it counts as a wake once it is half an ATR long:
Pine Script®
Pine Script®
While a wake lasts, the script remembers the longest it has been. When the wake has given back a quarter of that, it is fading. While it is at its longest, it is growing. When the current has turned against it, it is turning:
Pine Script®
When a wake ends, its longest length goes into a list of the last twenty. A wake that is already longer than three quarters of them is stretched: this move has run further than the market has usually run lately.
Pine Script®
Stretched is relative to the market in front of you. Two ATRs can be stretched on a quiet day and ordinary on a wild one.

⚪ 6. Price and the stream
Where price sits is measured from the current, in ATRs:
Pine Script®
Price is on the stream while it closes within 0.75 ATRs of the current. It has left the stream when it closes 1.5 ATRs away, and it has rejoined when it is back within 0.75. The gap between the two numbers is on purpose, so price can hover at the edge without an event firing on every bar.
⚪ 7. The pullback
A pullback to the current is only looked for while the river is flowing one way and the wake agrees:
Pine Script®
It arms when price has left the stream on the flowing side, which means the move ran ahead of its current. It fires when a bar then comes back to within 0.25 ATRs of the current and closes back on the flowing side of it:
Pine Script®
Pine Script®
After one fires, price has to leave the stream again before another can. That keeps it to the real pullbacks: a few per trend, and none at all in slack water.

⚪ 8. Events
One event a bar, the most important first: the current turning, then a pullback that held, then price leaving the stream, then price rejoining it, then the wake fading, then the wake stretching. Fading and stretched fire once per wake, and carry over to the next bar if something bigger took the slot.
Pine Script®
⚪ 9. The panel
⚪ Repainting
Every bar of the river is built only from the bars before it, so the historical river doesn't change. The current and the layers update on the live bar like any moving average does. Events are decided on closed bars and never move afterwards; on the live bar the panel says an event confirms on close.
█ WHY IT IS ORIGINAL
The ingredients are ordinary, two smoothed averages and an ATR, and we won't pretend otherwise. What is new is the construction and what it lets you read. A ribbon of averages shows you a stack of lines, each with its own length, that fan out and bunch up. The river has one fast series and one slow one, and the layers are blends between them, so the whole thing is a single shape that stretches into a wake and relaxes out of it. Colouring each layer by its own slope turns that shape into a picture of how deep a turn has gone, and the panel reads the depth off it. The wake is measured, remembered and compared with the wakes before it, so exhaustion and over-extension are readings of this market rather than fixed thresholds. The events come out of that geometry: a pullback is defined by the stream, not by a distance you set. None of that exists in a moving average cloud or a ribbon, and all of it is built so the chart carries the reading without a single label.
█ HOW TO USE IT
⚪ Colour first
Mint, the market is flowing up. Pink, it is flowing down. Blue, it is slack, and slack water is the one reading most tools don't give you: it means don't trend-trade here. The current's colour is the quickest read. The layers behind it tell you whether the rest of the river agrees.
⚪ Then the wake
A growing wake is a move with momentum behind it. A stretched wake is a move that has already run further than this market usually does. That is not a reversal call, strong trends stay stretched for a long time; it is a reason not to chase. A fading wake is a move losing speed, which is when to tighten up. A turning wake is the current already going the other way inside the old wake: the first stage of a turn, and the stage where most turns fail.

⚪ Trade with the current
The useful moments are the ones the events name. Price leaving the stream on the flowing side is a market extended away from its current; it tends to come back before it goes on. The pullback event is that return: price came back to the current and the current held. In a river with a growing wake, that is the location a trend trader waits for. Price leaving the stream against the flow, or the current turning while the wake is long, is a trend being tested.

⚪ Timeframes
With the defaults the current responds over about ten bars and the slow water over about sixty. On a 5-minute chart the wake describes the last few hours. On a 1-hour chart it is a few days. On a daily chart it is a quarter. Wake lengths and the stretched reading scale with the chart, because everything is in ATRs.

⚪ If you're new
Three sentences. The coloured line is where the market has been heading lately: mint up, pink down, blue going nowhere. The coloured water behind it is how hard the market has been moving: a long bright tail is a strong move, a tail that is shrinking is a move slowing down, no tail is a market drifting. The only moments worth waiting for are when price comes back to the line in a strong move and the line holds, and when the line changes colour.
None of this predicts where price goes. The river is a smoothed picture of where it has been, and an event isn't a buy or sell signal. Use it with your own analysis and manage your risk.
█ SETTINGS
⚪ Stream
⚪ Events
⚪ Look
Everything else, the shape of the layers, the smoothing of the colours, the slack zone and the wake memory, is fixed. Those numbers are right or wrong rather than a matter of taste, and we would rather you didn't have to think about them.
█ ALERTS
Set them to "Once per bar close". Events are only ever confirmed on a closed bar.
█ NOTES AND LIMITS
█ DISCLAIMER
This script is for education and information. It isn't financial advice, a recommendation to buy or sell anything, or a promise about what any market will do. Past behaviour of a market, a method or an indicator doesn't guarantee future results, and nothing on this chart replaces your own judgement. Trading involves risk and you are responsible for your decisions.
Every trend tool answers the same question, which way is the market going, and most of them answer it with a line that changes colour. The line tells you the direction. It tells you nothing about how hard the market is moving, whether the move is running out, or how far into a turn you are.
Stream Master draws the market as a river. The current is price smoothed twice over 10 bars. Around it, three layers of water follow the current with more and more lag, out to a slow water that follows price smoothed twice over 60 bars. When the market moves, the current runs ahead and the slow water trails behind, and the river leaves a wake: long and bright when the move is fast, gone when the market stalls. Every layer takes the up colour while it is flowing up and the down colour while it is flowing down, so a turn passes through the river from the inside out, and you can see how deep it has gone.
There are no labels on the chart. The shape and colour of the river is the whole read, and the panel in the corner says it in words: which way the current flows and how hard, how many of the four layers have turned, how long the wake is and whether it is growing, stretched, fading or turning, and where price sits relative to the current. The seven moments worth knowing about are alerts.
⚪ The river
Four layers make the river: the current and three edges. Each edge is a blend of the current and the slow water, the first about half way between them, the second most of the way, the third the slow water itself. Each is pushed out by a width that grows with its distance from the current, 35%, 70% and 100% of the river's full width, 3.5 ATRs each side by default. In slack water the river is a smooth band around the current. In a move the inner layers follow the current and the outer layers lag behind it, and the band stretches into a wake. The water is brightest at the current and fades toward the slow water, and the whole river dims when nothing is moving.
⚪ The wake
The wake is the distance between the current and the slow water, measured in ATRs. It is the memory of the move: how far the market has travelled, in its own volatility units, since the slow water last caught up. The script tracks the longest each wake gets, notices when it has started to give that back, and compares it with the last twenty wakes to say whether this move is already longer than the market usually runs.
⚪ What's different
The river is not a ribbon of moving averages. There are only two smoothed series in it, the current and the slow water, and the layers are blends between them, which is why the wake is one shape instead of a stack of lines. Each layer is coloured by its own slope rather than by the current's, so the picture shows how far a turn has spread, and the panel counts it. The wake is treated as a measured quantity with a memory, not just a gap between two lines. And the events are in the river's own vocabulary: the current turning, price leaving the stream and rejoining it, a pullback to the current that holds, the wake stretching, the wake fading.
█ HOW IT WORKS
⚪ 1. The current and the slow water
The current is price smoothed twice, which rounds it without the stepping a single average has. The slow water is the same thing over a much longer length:
Everything in the river is measured in ATRs, so the same settings mean the same thing on gold, on bitcoin and on a stock:
⚪ 2. The flow
The current's slope, in ATRs per bar and smoothed over 8 bars, is the flow. A flow of 0.12 ATRs a bar is full colour. Anything inside 15% of that is slack:
The current flows one way until its slope has crossed the slack zone to the other side. That is the turn, and it is the moment the panel's Since the turn row counts from:
⚪ 3. The layers
Each edge is a blend of the current and the slow water. The blend is curved, so the first edge sits about half way out, the second most of the way, and the third is the slow water itself:
The edge is then pushed out by a width that grows with its distance from the current, using a smoothed ATR so the river's width doesn't jump on one big bar:
⚪ 4. Colour by each layer's own slope
Every edge is coloured by its own slope, smoothed over 12 bars, not by the current's. The first edge is about half current and half slow water, so it turns a few bars after the current. The outer edge is the slow water, so it turns last. That is why a turn passes through the river from the inside out, and why the panel can count how many of the four layers have turned.
The colour runs from the slack blue to the up or down colour as the slope rises out of the slack zone, so the river brightens smoothly into a move instead of switching on:
Each layer's colour is held in steps of a tenth, and a step only moves once the slope has travelled a full step, so a fill keeps one colour for a run of bars instead of flickering between two shades while the slope sits on a boundary:
The six bands between the four layers are gradient fills, each running from the inner layer's colour to the outer layer's, brightest at the current and fading to the slow water. In a wake the outer layer can sit on the far side of the inner one, so each fill is told explicitly which of its two edges is on top.
⚪ 5. The wake, measured
The wake is the distance between the current and the slow water in ATRs, and it counts as a wake once it is half an ATR long:
While a wake lasts, the script remembers the longest it has been. When the wake has given back a quarter of that, it is fading. While it is at its longest, it is growing. When the current has turned against it, it is turning:
When a wake ends, its longest length goes into a list of the last twenty. A wake that is already longer than three quarters of them is stretched: this move has run further than the market has usually run lately.
Stretched is relative to the market in front of you. Two ATRs can be stretched on a quiet day and ordinary on a wild one.
⚪ 6. Price and the stream
Where price sits is measured from the current, in ATRs:
Price is on the stream while it closes within 0.75 ATRs of the current. It has left the stream when it closes 1.5 ATRs away, and it has rejoined when it is back within 0.75. The gap between the two numbers is on purpose, so price can hover at the edge without an event firing on every bar.
⚪ 7. The pullback
A pullback to the current is only looked for while the river is flowing one way and the wake agrees:
It arms when price has left the stream on the flowing side, which means the move ran ahead of its current. It fires when a bar then comes back to within 0.25 ATRs of the current and closes back on the flowing side of it:
After one fires, price has to leave the stream again before another can. That keeps it to the real pullbacks: a few per trend, and none at all in slack water.
⚪ 8. Events
One event a bar, the most important first: the current turning, then a pullback that held, then price leaving the stream, then price rejoining it, then the wake fading, then the wake stretching. Fading and stretched fire once per wake, and carry over to the next bar if something bigger took the slot.
⚪ 9. The panel
- Current: Flowing up or Flowing down, with strong, moderate or weak, or Slack while the current is inside the slack zone.
- Layers: how many of the four layers are flowing each way. 4 of 4 flowing up is a river in full flow. 2 up, 1 down is a turn in progress. All slack is a dead market.
- Wake: its direction and length in ATRs, and whether it is growing, stretched, fading or turning.
- Price: On the stream, or above or below it by so many ATRs.
- Since the turn: bars since the current last changed direction.
- Last event: the most recent event and how long ago. An event on the live bar shows as pending until the bar closes.
⚪ Repainting
Every bar of the river is built only from the bars before it, so the historical river doesn't change. The current and the layers update on the live bar like any moving average does. Events are decided on closed bars and never move afterwards; on the live bar the panel says an event confirms on close.
█ WHY IT IS ORIGINAL
The ingredients are ordinary, two smoothed averages and an ATR, and we won't pretend otherwise. What is new is the construction and what it lets you read. A ribbon of averages shows you a stack of lines, each with its own length, that fan out and bunch up. The river has one fast series and one slow one, and the layers are blends between them, so the whole thing is a single shape that stretches into a wake and relaxes out of it. Colouring each layer by its own slope turns that shape into a picture of how deep a turn has gone, and the panel reads the depth off it. The wake is measured, remembered and compared with the wakes before it, so exhaustion and over-extension are readings of this market rather than fixed thresholds. The events come out of that geometry: a pullback is defined by the stream, not by a distance you set. None of that exists in a moving average cloud or a ribbon, and all of it is built so the chart carries the reading without a single label.
█ HOW TO USE IT
⚪ Colour first
Mint, the market is flowing up. Pink, it is flowing down. Blue, it is slack, and slack water is the one reading most tools don't give you: it means don't trend-trade here. The current's colour is the quickest read. The layers behind it tell you whether the rest of the river agrees.
⚪ Then the wake
A growing wake is a move with momentum behind it. A stretched wake is a move that has already run further than this market usually does. That is not a reversal call, strong trends stay stretched for a long time; it is a reason not to chase. A fading wake is a move losing speed, which is when to tighten up. A turning wake is the current already going the other way inside the old wake: the first stage of a turn, and the stage where most turns fail.
⚪ Trade with the current
The useful moments are the ones the events name. Price leaving the stream on the flowing side is a market extended away from its current; it tends to come back before it goes on. The pullback event is that return: price came back to the current and the current held. In a river with a growing wake, that is the location a trend trader waits for. Price leaving the stream against the flow, or the current turning while the wake is long, is a trend being tested.
⚪ Timeframes
With the defaults the current responds over about ten bars and the slow water over about sixty. On a 5-minute chart the wake describes the last few hours. On a 1-hour chart it is a few days. On a daily chart it is a quarter. Wake lengths and the stretched reading scale with the chart, because everything is in ATRs.
⚪ If you're new
Three sentences. The coloured line is where the market has been heading lately: mint up, pink down, blue going nowhere. The coloured water behind it is how hard the market has been moving: a long bright tail is a strong move, a tail that is shrinking is a move slowing down, no tail is a market drifting. The only moments worth waiting for are when price comes back to the line in a strong move and the line holds, and when the line changes colour.
None of this predicts where price goes. The river is a smoothed picture of where it has been, and an event isn't a buy or sell signal. Use it with your own analysis and manage your risk.
█ SETTINGS
⚪ Stream
- Current (bars): the current is price smoothed twice over this many bars. 10 by default. Lower follows price more closely, higher is calmer.
- Wake (bars): the slow water is price smoothed twice over this many bars. 60 by default. The bigger the gap between this and the current, the longer the wake a move leaves.
- River width (ATRs): how wide the river is in slack water, each side of the current at its outer edge. 3.5 by default.
- History (bars): how far back the river is drawn, 1,500 bars by default. Scroll further back and it simply stops. Lower it if your chart feels slow.
⚪ Events
- Price has left the stream at (ATRs): 1.5 by default.
- And is back on it within (ATRs): 0.75 by default.
- A pullback reaches the current within (ATRs): 0.25 by default.
⚪ Look
- Theme: Neon, Classic, Aurora, Ice, or Custom with your own slack, up and down colours.
- Brightness: 1 to 5, for your screen and background.
- Slack water: how visible the river is when nothing is moving. 1 is almost invisible, 5 keeps it as bright as a move.
- Current line: show or hide the current itself.
- Panel: position and size.
Everything else, the shape of the layers, the smoothing of the colours, the slack zone and the wake memory, is fixed. Those numbers are right or wrong rather than a matter of taste, and we would rather you didn't have to think about them.
█ ALERTS
- Current turned up, Current turned down.
- Price left the stream, Price rejoined the stream.
- Pullback to the current.
- Wake stretched, Wake fading.
Set them to "Once per bar close". Events are only ever confirmed on a closed bar.
█ NOTES AND LIMITS
- The river lags, by construction. The current is a double smoothing and turns some bars after price does; the slow water turns long after. The wake is that lag, drawn. A V-shaped reversal will always be a few bars old before the current turns, and the outer layers keep the old colour for a while. That is the honest picture of a smoothed trend tool, and it is why the depth of a turn is shown rather than hidden.
- In a sideways market the current can change colour several times before the slack zone catches it. The slack zone and the colour steps remove most of the flicker, not all of it. A river that keeps changing colour with no wake is itself the read: nothing is flowing.
- Stretched is relative. It compares the present wake with the last twenty on your chart and needs at least five of them, so it stays silent early in a short history. In a market that has only chopped for weeks, the first real move will read as stretched almost at once.
- Everything is in ATRs. When a symbol's volatility changes regime, the river's width and the events adjust with it. That is the point, but it means 1.5 ATRs is a different distance on different days.
- The pullback event looks for one sequence, left the stream on the flowing side, back to the current, closed on the flowing side, and will miss pullbacks that never quite reach the current or never quite left the stream. It fires on the close that completes the sequence, never earlier.
- Only the last 1,500 bars are drawn, to keep the chart quick. A hidden copy of the indicator still calculates, so remove any you aren't using.
- The river is six gradient fills. On very long charts or slow machines, lower History first.
█ DISCLAIMER
This script is for education and information. It isn't financial advice, a recommendation to buy or sell anything, or a promise about what any market will do. Past behaviour of a market, a method or an indicator doesn't guarantee future results, and nothing on this chart replaces your own judgement. Trading involves risk and you are responsible for your decisions.

Access our exclusive invite-only scripts: simplealgo.io
Join our discord: discord.gg/simplealgo
Join our discord: discord.gg/simplealgo
免責聲明
這些資訊和出版物並非旨在提供,也不構成TradingView提供或認可的任何形式的財務、投資、交易或其他類型的建議或推薦。請閱讀使用條款以了解更多資訊。
Access our exclusive invite-only scripts: simplealgo.io
Join our discord: discord.gg/simplealgo
Join our discord: discord.gg/simplealgo
免責聲明
這些資訊和出版物並非旨在提供,也不構成TradingView提供或認可的任何形式的財務、投資、交易或其他類型的建議或推薦。請閱讀使用條款以了解更多資訊。