OPEN-SOURCE SCRIPT
已更新 AlexD Market annual seasonality
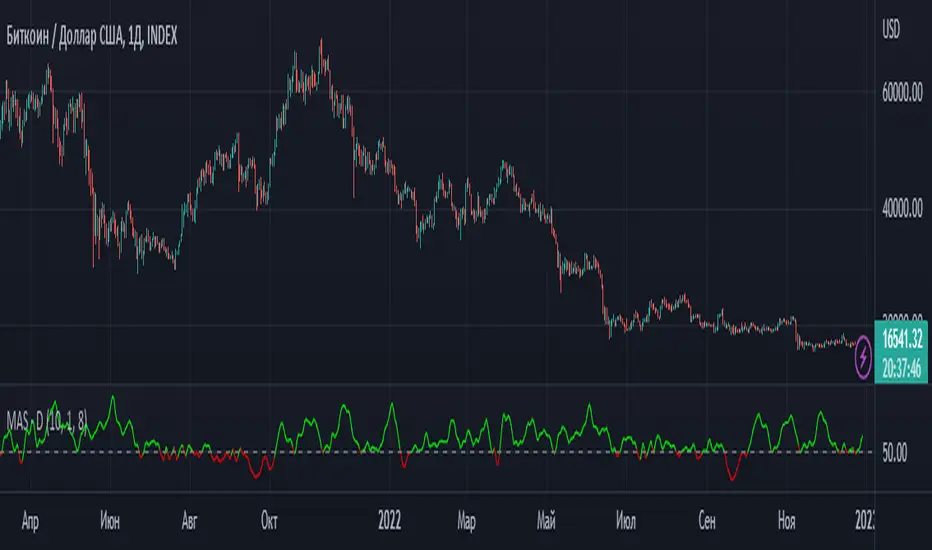
The indicator displays the percentage of bullish days with a given date over several years.
This allows you to determine the days of the year when the price usually goes up or down.
Indicator has a built-in "simple moving average" shifted back by half a period, due to which the delay of this smoothing is removed.
This allows you to determine the days of the year when the price usually goes up or down.
Indicator has a built-in "simple moving average" shifted back by half a period, due to which the delay of this smoothing is removed.
發行說明
Offset removed from plot() function發行說明
Added smoothing when sampling the day of the year.The "Depth" property indicates how many bars to take for smoothing to the left and right of the found day.
Extreme bars are taken with less weighting for smooth signal decay.
I recommend setting "Depth" to 1. If you don't need to use this feature, set "Depth" to 0.
This is the final functionality change. Further changes are possible to optimize the indicator.
開源腳本
秉持TradingView一貫精神,這個腳本的創作者將其設為開源,以便交易者檢視並驗證其功能。向作者致敬!您可以免費使用此腳本,但請注意,重新發佈代碼需遵守我們的社群規範。

免責聲明
這些資訊和出版物並非旨在提供,也不構成TradingView提供或認可的任何形式的財務、投資、交易或其他類型的建議或推薦。請閱讀使用條款以了解更多資訊。
免責聲明
這些資訊和出版物並非旨在提供,也不構成TradingView提供或認可的任何形式的財務、投資、交易或其他類型的建議或推薦。請閱讀使用條款以了解更多資訊。