已更新
RobinHood Stochastics Oscillator RSI - RSOR
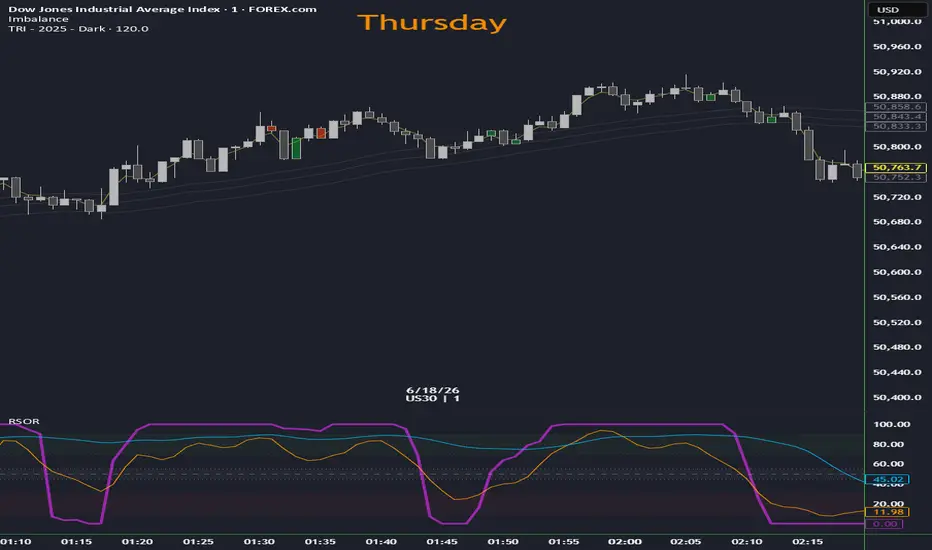
Overview This indicator is a complete Pine Script v6 port of the custom "RSOR" (RSI of EMA + Stochastics) indicator originally built for MT4 (MQL4). It combines a unique momentum calculation—RSI of EMA—with two distinct Stochastic oscillators (Fast and Slow) into a single, clean pane.
How It Works
How to Use It Traders can use this indicator to identify momentum exhaustion, divergences, and trend entries:
Visual Groupings and Zones To enhance readability without overpowering the price chart, the indicator features 3 distinct background zones with subtle opacity fills:
How It Works
- []RSI of EMA (Purple Line): Unlike the traditional Wilder's RSI, this script calculates the relative strength based on the difference between consecutive Exponential Moving Averages (EMA). It uses a custom "Simple Sum" logic to accumulate gains and losses over the specified period, making it highly reactive to momentum shifts. []Stochastic Fast & Slow: The indicator utilizes dual Stochastics. Both the Fast (Orange) and Slow (Blue) Stochastics are configured to smooth their %D signal lines using an EMA (mirroring the MODE_EMA parameter from MT4). The raw %K lines are hidden to reduce chart clutter, focusing strictly on the smoothed %D signal lines.
How to Use It Traders can use this indicator to identify momentum exhaustion, divergences, and trend entries:
- []Look for the RSI of EMA to cross into the extreme zones (above 70 or below 30) for potential reversal setups. []Use the direction and positioning of the Fast and Slow Stochastics relative to the neutral zone to gauge the primary trend.
- Confluence between the RSI of EMA and Stochastics leaving the shaded extreme zones provides high-probability entry signals.
Visual Groupings and Zones To enhance readability without overpowering the price chart, the indicator features 3 distinct background zones with subtle opacity fills:
- []Oversold Zone (10 - 30): Bounded by red dotted lines with a very light red background fill to indicate extreme downside momentum. []Neutral Zone (45 - 55): Bounded by white dotted/dashed lines with a light white background fill to define the midline chop zone.
- Overbought Zone (70 - 90): Bounded by green dotted lines with a light green background fill to indicate extreme upside momentum.
發行說明
Updated indicator's name
免責聲明
這些資訊和出版物並非旨在提供,也不構成TradingView提供或認可的任何形式的財務、投資、交易或其他類型的建議或推薦。請閱讀使用條款以了解更多資訊。