OPEN-SOURCE SCRIPT
已更新 Big Trades Whale Detector [Volume Anomalies] By HK
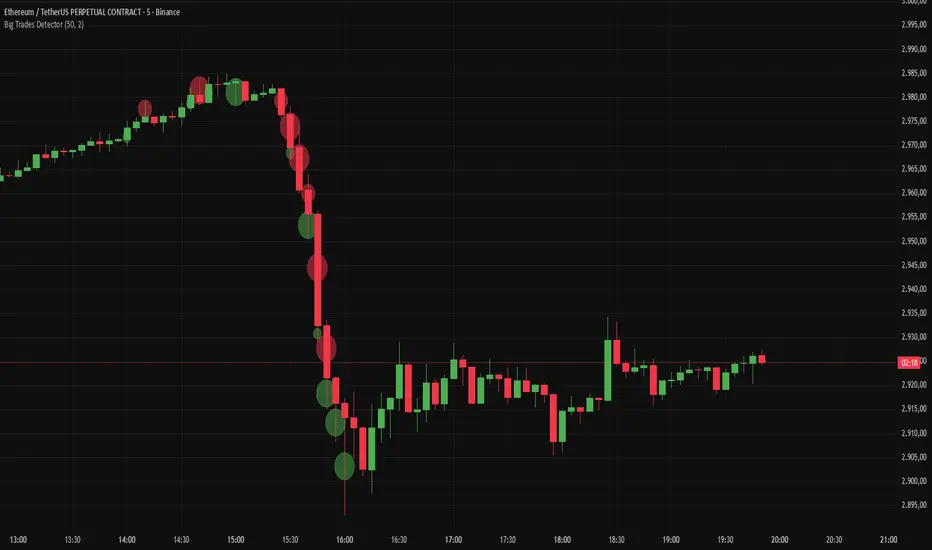
Overview The "Big Trade Detector" helps you spot institutional footprints by identifying volume anomalies that act as outliers compared to recent history. It uses statistical analysis (Standard Deviation) to filter out noise and highlight only significant buying or selling pressure.
Features:
Volume Decomposition: Approximates buy/sell volume based on price action within the candle (Close vs. Range).
3-Tier Detection: Uses dynamic thresholds to categorize volume spikes into Small, Medium, and Extreme events.
Smart Calculation: Compares current volume against the previous average to detect sudden shifts in momentum.
Visuals:
Green Circles (Below Bar): Unusual Buying Pressure (Support defense or Breakout).
Red Circles (Above Bar): Unusual Selling Pressure (Resistance defense or Dump).
Size Matters: The larger the circle, the higher the standard deviation (Sigma) of that volume event.
Features:
Volume Decomposition: Approximates buy/sell volume based on price action within the candle (Close vs. Range).
3-Tier Detection: Uses dynamic thresholds to categorize volume spikes into Small, Medium, and Extreme events.
Smart Calculation: Compares current volume against the previous average to detect sudden shifts in momentum.
Visuals:
Green Circles (Below Bar): Unusual Buying Pressure (Support defense or Breakout).
Red Circles (Above Bar): Unusual Selling Pressure (Resistance defense or Dump).
Size Matters: The larger the circle, the higher the standard deviation (Sigma) of that volume event.
發行說明
Overview The "Big Trade Detector" helps you spot institutional footprints by identifying volume anomalies that act as outliers compared to recent history. It uses statistical analysis (Standard Deviation) to filter out noise and highlight only significant buying or selling pressure.Features:
Volume Decomposition: Approximates buy/sell volume based on price action within the candle (Close vs. Range).
3-Tier Detection: Uses dynamic thresholds to categorize volume spikes into Small, Medium, and Extreme events.
Smart Calculation: Compares current volume against the previous average to detect sudden shifts in momentum.
Visuals:
Green Circles (Below Bar): Unusual Buying Pressure (Support defense or Breakout).
Red Circles (Above Bar): Unusual Selling Pressure (Resistance defense or Dump).
Size Matters: The larger the circle, the higher the standard deviation (Sigma) of that volume event.
發行說明
Changes:Updated to Pine Script v6.
Improved Visuals: Big Trade circles are no longer floating above/below bars. They are now plotted at absolute price levels to better reflect where the volume activity occurred within the candle.
Buys: Plotted at the average of Low and Close.
Sells: Plotted at the average of High and Close.
發行說明
Big Update!How it works:
Intrabar Precision: The script inspects the candle using lower timeframe data (default: 5-second ticks) to find exactly where the volume occurred.
Volume Filtering: It filters out noise and only plots bubbles when a specific volume threshold (Minimum Volume) is hit within that 5-second window.
Smart Coloring: Bubbles are colored Green (Buy) or Red (Sell) based on the price action within that specific micro-movement.
⚙️ Settings:
Minimum Volume: Set the threshold for big trades (e.g., 150+ for ETH, higher for BTC).
Circle Size: Controls the background bubble.
Font Size: Controls the text readability independently.
⚠️ Important Visual Tip: If the text appears "behind" the candles or disappears:
Right-click any of the indicator Volume Text/Bubbles.
Select Visual Order -> Bring to Front. (This is a standard TradingView setting to ensure labels stay on top of price bars).
發行說明
I have reverted the last Update to the original code without premium features.發行說明
Buy/sell dots enlarged for better visibility, and default Transparency set to 50%開源腳本
秉持TradingView一貫精神,這個腳本的創作者將其設為開源,以便交易者檢視並驗證其功能。向作者致敬!您可以免費使用此腳本,但請注意,重新發佈代碼需遵守我們的社群規範。

免責聲明
這些資訊和出版物並非旨在提供,也不構成TradingView提供或認可的任何形式的財務、投資、交易或其他類型的建議或推薦。請閱讀使用條款以了解更多資訊。
免責聲明
這些資訊和出版物並非旨在提供,也不構成TradingView提供或認可的任何形式的財務、投資、交易或其他類型的建議或推薦。請閱讀使用條款以了解更多資訊。