OPEN-SOURCE SCRIPT
Trend Quality Score (TQS)
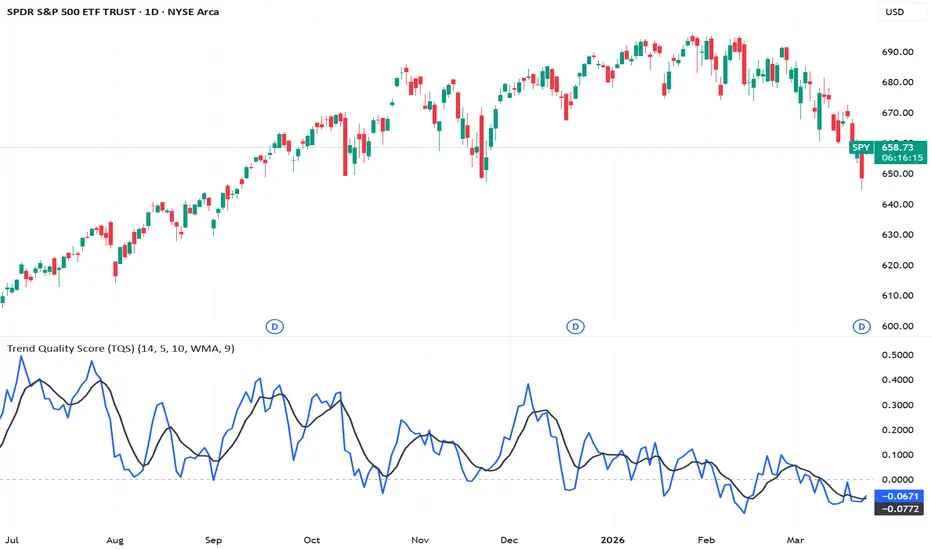
Trend Quality Score (TQS) is a composite indicator designed to evaluate the strength, direction, and consistency of a trend in a single normalized signal.
The indicator combines three core components derived from price action and directional movement:
These components are weighted and combined into a single score (TQS), which fluctuates around zero:
A configurable moving average can be applied to TQS to help identify shifts in trend quality and improve signal clarity.
Key Features
How to Use
Use TQS above zero to confirm bullish conditions and below zero for bearish conditions
Look for crossovers between TQS and its moving average as potential shifts in trend quality
Avoid trading when TQS is near zero, as this indicates low-quality or sideways markets
This indicator is designed as a confirmation and filtering tool and works best when combined with a broader trading strategy.
The indicator combines three core components derived from price action and directional movement:
- Directional Strength – Measures the relative dominance of buyers vs. sellers using the difference between +DI and -DI.
- Trend Strength (DX) – Captures the magnitude of directional movement, smoothed to reduce noise.
- Trend Persistence – Evaluates how consistently price has been moving in one direction over a defined lookback period.
These components are weighted and combined into a single score (TQS), which fluctuates around zero:
- Positive values indicate upward trend conditions
- Negative values indicate downward trend conditions
- Values near zero suggest weak or non-trending markets
A configurable moving average can be applied to TQS to help identify shifts in trend quality and improve signal clarity.
Key Features
- Combines strength, direction, and persistence into one metric
- Helps distinguish strong trends from choppy conditions
- Customizable smoothing and moving average type (SMA, EMA, WMA, RMA)
- Suitable for trend confirmation, filtering trades, or regime detection
How to Use
Use TQS above zero to confirm bullish conditions and below zero for bearish conditions
Look for crossovers between TQS and its moving average as potential shifts in trend quality
Avoid trading when TQS is near zero, as this indicates low-quality or sideways markets
This indicator is designed as a confirmation and filtering tool and works best when combined with a broader trading strategy.
開源腳本
秉持TradingView一貫精神,這個腳本的創作者將其設為開源,以便交易者檢視並驗證其功能。向作者致敬!您可以免費使用此腳本,但請注意,重新發佈代碼需遵守我們的社群規範。

免責聲明
這些資訊和出版物並非旨在提供,也不構成TradingView提供或認可的任何形式的財務、投資、交易或其他類型的建議或推薦。請閱讀使用條款以了解更多資訊。
開源腳本
秉持TradingView一貫精神,這個腳本的創作者將其設為開源,以便交易者檢視並驗證其功能。向作者致敬!您可以免費使用此腳本,但請注意,重新發佈代碼需遵守我們的社群規範。
免責聲明
這些資訊和出版物並非旨在提供,也不構成TradingView提供或認可的任何形式的財務、投資、交易或其他類型的建議或推薦。請閱讀使用條款以了解更多資訊。