OPEN-SOURCE SCRIPT
Leveraged ETF Volatility Decay Indicator
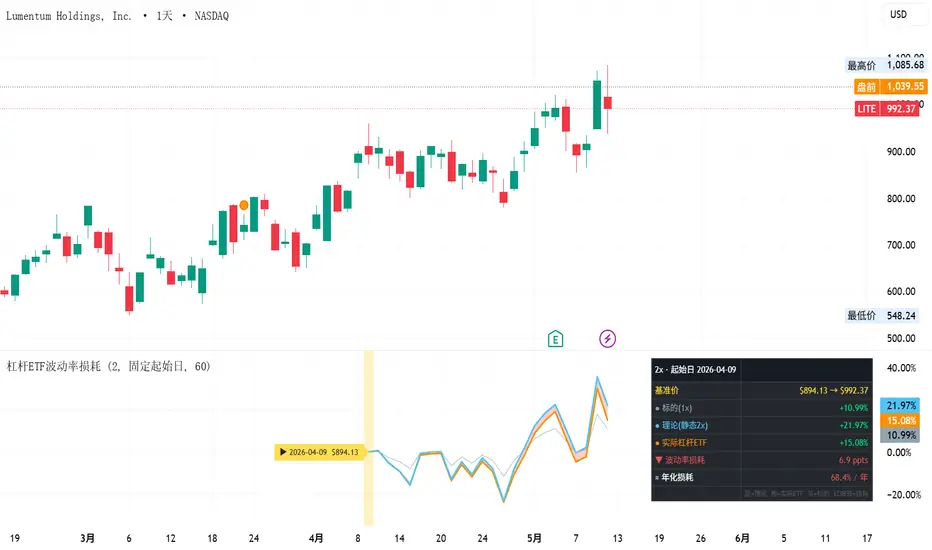
# 杠杆ETF波动率损耗指标 / Leveraged ETF Volatility Decay Indicator
## 它是什么 / What is it
杠杆ETF(如TQQQ、SOXL、UPRO)承诺每日N倍于标的指数的收益率。但由于**每日再平衡**机制,长期持有会产生**波动率损耗(Volatility Decay)**——即使标的指数回到原点,杠杆ETF也会亏损。
本指标直观展示这种损耗的大小,帮助你理解持有杠杆ETF的真实成本。
Leveraged ETFs (e.g. TQQQ, SOXL, UPRO) promise N× the daily return of an underlying index. However, due to **daily rebalancing**, long-term holding incurs **volatility decay** — even if the index returns to breakeven, the leveraged ETF will show a loss.
This indicator visualizes the magnitude of this decay, helping you understand the true cost of holding leveraged ETFs.
---
## 三条线的含义 / What the three lines mean
| 颜色 Color | 名称 Name | 含义 Meaning |
|-----------|-----------|-------------|
| 灰色 Gray | 标的资产 (1x) / Underlying | 标的指数的累计涨跌幅 / Cumulative return of the underlying index |
| 蓝色 Blue | 理论值 (静态杠杆) / Theoretical (static leverage) | N × 标的涨幅,即"借钱买入不调仓"的理想收益 / N × underlying return, the ideal return from static leverage (borrow and hold) |
| 橙色 Orange | 实际杠杆ETF / Actual Leveraged ETF | 模拟每日再平衡后的实际累计收益 / Simulated cumulative return with daily rebalancing |
| 红色填充 Red fill | 损耗区域 / Decay zone | 蓝线与橙线之间的差值 = 被波动率吞掉的收益 / Gap between blue and orange = return eaten by volatility |
**核心公式 / Core formula:**
```
实际杠杆ETF = ∏(1 + N × rₜ) 每日复利
理论静态杠杆 = 1 + N × (标的总涨幅) 简单倍数
损耗 = 理论 - 实际
```
---
## 两种计算模式 / Two calculation modes
### 模式一:固定起始日 / Fixed Start Date
从你指定的日期开始,计算到当前K线的累计损耗。
Calculates cumulative decay from a specified date to the current bar.
**适用场景 / Use case:**
- 分析"如果在某天买入并持有到现在,损耗有多少"
- Analyze "if I bought on date X and held until now, how much decay would I suffer"
### 模式二:滚动窗口 / Rolling Window
每根K线独立计算"最近N个交易日"内的损耗,形成连续曲线。
Each bar independently calculates decay over the last N trading days, forming a continuous curve.
**适用场景 / Use case:**
- 不依赖特定入场日期,适合反复交易的人
- 观察损耗随市场环境(趋势 vs 震荡)的变化
- Not dependent on a specific entry date, suitable for active traders
- Observe how decay changes with market conditions (trending vs choppy)
---
## 参数说明 / Parameters
| 参数 Parameter | 默认值 Default | 说明 Description |
|---------------|---------------|-----------------|
| 杠杆倍数 (N) / Leverage | 2.0 | 模拟的杠杆倍数。2=双倍(如QLD/SSO),3=三倍(如TQQQ/SOXL) / Leverage multiplier |
| 计算模式 / Mode | 固定起始日 | 选择固定起始日或滚动窗口 / Choose fixed start date or rolling window |
| 起始日期 / Start Date | 2024-01-01 | 固定模式下的计算起点,添加指标时可直接在图表上点选 / Start point for fixed mode |
| 滚动天数 / Rolling Days | 60 | 滚动模式下回看的交易日数量 / Lookback period for rolling mode |
---
## 信息表格说明 / Info Table
右上角表格显示以下数据 / The top-right table shows:
| 行 Row | 含义 Meaning |
|--------|-------------|
| 基准价 / Base Price | 起始价 → 当前价 / Start price → current price |
| 标的 (1x) | 标的指数累计涨跌幅 / Underlying cumulative return |
| 理论 (静态Nx) | N倍标的涨幅 = 不调仓的理想收益 / N× underlying return |
| 实际杠杆ETF | 每日再平衡后的真实收益 / Actual return after daily rebalancing |
| 波动率损耗 | 理论 - 实际,单位为百分点(ppts) / Theoretical − actual, in percentage points |
| 年化损耗 | 基于近252日波动率估算,公式 N(N-1)/2 × σ² × 252 / Annualized estimate |
---
## 使用建议 / Usage Tips
1. **推荐加载到标的指数上**(如QQQ、SPY、SOX),而非杠杆ETF本身,因为本指标是用标的的日收益率来模拟杠杆ETF的表现。
**Load on the underlying index** (e.g. QQQ, SPY, SOX), not on the leveraged ETF itself, because this indicator simulates leveraged ETF performance from the underlying's daily returns.
2. **使用日线**。杠杆ETF按日再平衡,日线是最准确的时间尺度。
**Use daily timeframe.** Leveraged ETFs rebalance daily, so the daily chart is the most accurate scale.
3. **观察红色填充区域的厚度变化**:
- 震荡行情 → 红色越来越厚(损耗加速)
- 单边趋势 → 红色很薄甚至变绿(ETF跑赢静态杠杆)
**Watch how the red fill area changes:**
- Choppy market → red grows thicker (decay accelerates)
- Strong trend → red stays thin or turns green (ETF outperforms static leverage)
4. **滚动模式下调整天数**来匹配你的持有周期。持有2个月就设60天,持有半年就设120天。
**In rolling mode, adjust the window** to match your holding period.
---
## 损耗的数学原理 / Math Behind the Decay
标的日收益率为 rₜ,N倍杠杆ETF每日收益为 N×rₜ。
对两者取对数展开到二阶项:
```
ln(1 + N×r) ≈ N×r − N²r²/2
N × ln(1+r) ≈ N×r − N×r²/2
```
差值 = −N(N−1)/2 × r²,累计 T 天后:
```
损耗 ≈ N(N-1)/2 × σ² × T
```
| 杠杆倍数 N | 系数 N(N-1)/2 | 标的日波动率1%时年化损耗 |
|-----------|--------------|----------------------|
| 2x | 1 | ≈ 2.52% |
| 3x | 3 | ≈ 7.56% |
**关键结论 / Key takeaway:** 损耗与波动率的**平方**成正比,与杠杆倍数**非线性**增长。3倍杠杆的损耗是2倍的3倍,而非1.5倍。
Decay grows with the **square** of volatility and **non-linearly** with leverage. 3x leverage has 3× the decay of 2x, not 1.5×.
## 它是什么 / What is it
杠杆ETF(如TQQQ、SOXL、UPRO)承诺每日N倍于标的指数的收益率。但由于**每日再平衡**机制,长期持有会产生**波动率损耗(Volatility Decay)**——即使标的指数回到原点,杠杆ETF也会亏损。
本指标直观展示这种损耗的大小,帮助你理解持有杠杆ETF的真实成本。
Leveraged ETFs (e.g. TQQQ, SOXL, UPRO) promise N× the daily return of an underlying index. However, due to **daily rebalancing**, long-term holding incurs **volatility decay** — even if the index returns to breakeven, the leveraged ETF will show a loss.
This indicator visualizes the magnitude of this decay, helping you understand the true cost of holding leveraged ETFs.
---
## 三条线的含义 / What the three lines mean
| 颜色 Color | 名称 Name | 含义 Meaning |
|-----------|-----------|-------------|
| 灰色 Gray | 标的资产 (1x) / Underlying | 标的指数的累计涨跌幅 / Cumulative return of the underlying index |
| 蓝色 Blue | 理论值 (静态杠杆) / Theoretical (static leverage) | N × 标的涨幅,即"借钱买入不调仓"的理想收益 / N × underlying return, the ideal return from static leverage (borrow and hold) |
| 橙色 Orange | 实际杠杆ETF / Actual Leveraged ETF | 模拟每日再平衡后的实际累计收益 / Simulated cumulative return with daily rebalancing |
| 红色填充 Red fill | 损耗区域 / Decay zone | 蓝线与橙线之间的差值 = 被波动率吞掉的收益 / Gap between blue and orange = return eaten by volatility |
**核心公式 / Core formula:**
```
实际杠杆ETF = ∏(1 + N × rₜ) 每日复利
理论静态杠杆 = 1 + N × (标的总涨幅) 简单倍数
损耗 = 理论 - 实际
```
---
## 两种计算模式 / Two calculation modes
### 模式一:固定起始日 / Fixed Start Date
从你指定的日期开始,计算到当前K线的累计损耗。
Calculates cumulative decay from a specified date to the current bar.
**适用场景 / Use case:**
- 分析"如果在某天买入并持有到现在,损耗有多少"
- Analyze "if I bought on date X and held until now, how much decay would I suffer"
### 模式二:滚动窗口 / Rolling Window
每根K线独立计算"最近N个交易日"内的损耗,形成连续曲线。
Each bar independently calculates decay over the last N trading days, forming a continuous curve.
**适用场景 / Use case:**
- 不依赖特定入场日期,适合反复交易的人
- 观察损耗随市场环境(趋势 vs 震荡)的变化
- Not dependent on a specific entry date, suitable for active traders
- Observe how decay changes with market conditions (trending vs choppy)
---
## 参数说明 / Parameters
| 参数 Parameter | 默认值 Default | 说明 Description |
|---------------|---------------|-----------------|
| 杠杆倍数 (N) / Leverage | 2.0 | 模拟的杠杆倍数。2=双倍(如QLD/SSO),3=三倍(如TQQQ/SOXL) / Leverage multiplier |
| 计算模式 / Mode | 固定起始日 | 选择固定起始日或滚动窗口 / Choose fixed start date or rolling window |
| 起始日期 / Start Date | 2024-01-01 | 固定模式下的计算起点,添加指标时可直接在图表上点选 / Start point for fixed mode |
| 滚动天数 / Rolling Days | 60 | 滚动模式下回看的交易日数量 / Lookback period for rolling mode |
---
## 信息表格说明 / Info Table
右上角表格显示以下数据 / The top-right table shows:
| 行 Row | 含义 Meaning |
|--------|-------------|
| 基准价 / Base Price | 起始价 → 当前价 / Start price → current price |
| 标的 (1x) | 标的指数累计涨跌幅 / Underlying cumulative return |
| 理论 (静态Nx) | N倍标的涨幅 = 不调仓的理想收益 / N× underlying return |
| 实际杠杆ETF | 每日再平衡后的真实收益 / Actual return after daily rebalancing |
| 波动率损耗 | 理论 - 实际,单位为百分点(ppts) / Theoretical − actual, in percentage points |
| 年化损耗 | 基于近252日波动率估算,公式 N(N-1)/2 × σ² × 252 / Annualized estimate |
---
## 使用建议 / Usage Tips
1. **推荐加载到标的指数上**(如QQQ、SPY、SOX),而非杠杆ETF本身,因为本指标是用标的的日收益率来模拟杠杆ETF的表现。
**Load on the underlying index** (e.g. QQQ, SPY, SOX), not on the leveraged ETF itself, because this indicator simulates leveraged ETF performance from the underlying's daily returns.
2. **使用日线**。杠杆ETF按日再平衡,日线是最准确的时间尺度。
**Use daily timeframe.** Leveraged ETFs rebalance daily, so the daily chart is the most accurate scale.
3. **观察红色填充区域的厚度变化**:
- 震荡行情 → 红色越来越厚(损耗加速)
- 单边趋势 → 红色很薄甚至变绿(ETF跑赢静态杠杆)
**Watch how the red fill area changes:**
- Choppy market → red grows thicker (decay accelerates)
- Strong trend → red stays thin or turns green (ETF outperforms static leverage)
4. **滚动模式下调整天数**来匹配你的持有周期。持有2个月就设60天,持有半年就设120天。
**In rolling mode, adjust the window** to match your holding period.
---
## 损耗的数学原理 / Math Behind the Decay
标的日收益率为 rₜ,N倍杠杆ETF每日收益为 N×rₜ。
对两者取对数展开到二阶项:
```
ln(1 + N×r) ≈ N×r − N²r²/2
N × ln(1+r) ≈ N×r − N×r²/2
```
差值 = −N(N−1)/2 × r²,累计 T 天后:
```
损耗 ≈ N(N-1)/2 × σ² × T
```
| 杠杆倍数 N | 系数 N(N-1)/2 | 标的日波动率1%时年化损耗 |
|-----------|--------------|----------------------|
| 2x | 1 | ≈ 2.52% |
| 3x | 3 | ≈ 7.56% |
**关键结论 / Key takeaway:** 损耗与波动率的**平方**成正比,与杠杆倍数**非线性**增长。3倍杠杆的损耗是2倍的3倍,而非1.5倍。
Decay grows with the **square** of volatility and **non-linearly** with leverage. 3x leverage has 3× the decay of 2x, not 1.5×.
開源腳本
秉持TradingView一貫精神,這個腳本的創作者將其設為開源,以便交易者檢視並驗證其功能。向作者致敬!您可以免費使用此腳本,但請注意,重新發佈代碼需遵守我們的社群規範。

免責聲明
這些資訊和出版物並非旨在提供,也不構成TradingView提供或認可的任何形式的財務、投資、交易或其他類型的建議或推薦。請閱讀使用條款以了解更多資訊。
免責聲明
這些資訊和出版物並非旨在提供,也不構成TradingView提供或認可的任何形式的財務、投資、交易或其他類型的建議或推薦。請閱讀使用條款以了解更多資訊。