已更新
DTE ATM Straddle & Flow
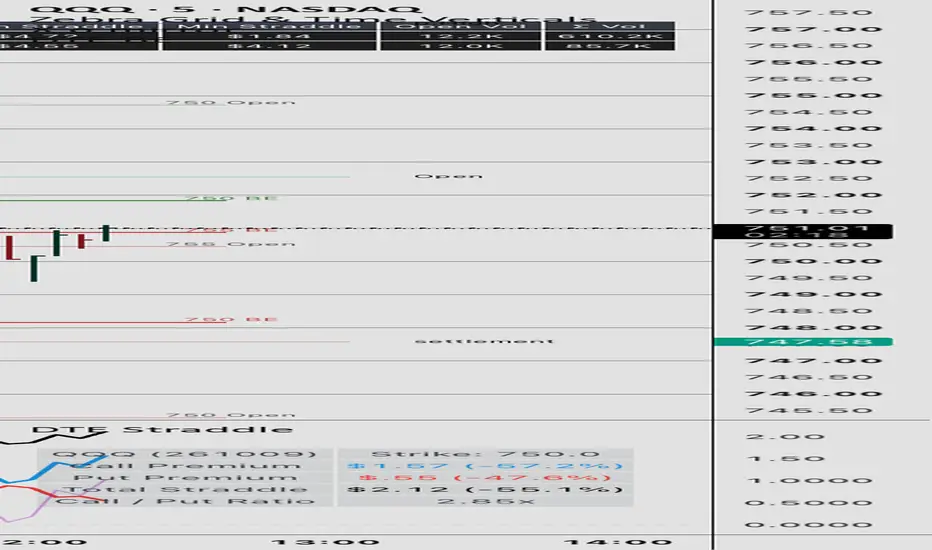
The 0DTE ATM Straddle & Flow Tracker is a real-time options flow and volatility tracking tool designed for day traders trading daily-expiring (0DTE) contracts on major index products (QQQ, SPY, and SPX).
It aggregates real-time OPRA option chain data inside Pine Script to display price movement, volatility decay, and order flow bias.
Key Features
Automated 0DTE Ticker Construction: Automatically generates OPRA option tickers for Call and Put options matching today's date ($YYMMDD$) in Eastern Time. Automatically handles the weekly root conversion for SPX (SPXW).
Intraday Premium Decay Tracking: Locks the 9:30 AM EST market open price to calculate percentage gain/loss (theta decay or volatility expansion) on the Call, the Put, and the combined Straddle price ( CALL + Put$).
Market Maker Hedging Bias: Evaluates relative premium skew (CALL - Put$) to categorize institutional dealer hedging pressure in real time (e.g., Accelerated Call Squeeze, Put Dump, or Neutral Chop).
Visual Skew Flip Alerts: Highlights the chart background when net options premium crosses zero, signaling a shift in intraday dealer delta exposure.
Core Metrics Defined
Call / Put Premium: Live market price of individual legs. Identifies which side of the option chain is attracting aggressive buying.
Total Straddle: Combined value (CALL + Put$). Tracks total implied move priced into the market for the current session.
ol Regime: Evaluates total straddle decay vs. 9:30 AM open. Shows if options are undergoing THETA CRUSH ($<-20\%$) or VOL EXPANSION ($>+10\%$).
Net Premium (C - P): Dollar difference between Call and Put value. Crosses above/below zero signal real-time directional order flow shifts.
MM Hedging Bias: Dealer delta alignment based on premium ratio. Flags potential acceleration zones (squeezes/dumps) vs. range-bound chop.
How to Set Up and Use the Indicator
Step 1: Add to TradingView
Open TradingView and navigate to any chart.
Click the Pine Editor tab at the bottom of the screen.
Paste the Pine Script v6 code into the editor and click Save.
Click Add to Chart (the indicator runs in a separate panel below your main price chart).
Step 2: Configure Settings Each Morning
Open the indicator Settings gear icon:
Underlying Symbol: Choose QQQ, SPY, or SPX.
Strike Price: Enter the active At-The-Money (ATM) strike price near the market open (e.g., 760 for QQQ, 580 for SPY, 5800 for SPX).
DTE Expiry (YYMMDD): Leave blank to automatically select today's 0DTE date, or manually input a specific date (e.g., 261006 for Oct 6, 2026).
How to Interpret Signals in Live Trading
Scenario A: Theta Crush / Range-Bound Market
Dashboard Readout: Vol Regime: THETA CRUSH (Straddle down $>20\%$).
Flow State: MM Hedging Bias: NEUTRAL / CHOP.
Actionable Takeaway: Option sellers are draining extrinsic value. Expect price to stay pinned between key gamma levels. Long straddles/strangles will suffer heavy decay.
Scenario B: Momentum Expansion (Call Squeeze)
Dashboard Readout: MM Hedging Bias: ACCEL BUYING (CALL SQUEEZE).
Chart Signal: Background flashes Blue (Net premium crossed above zero).
Actionable Takeaway: Call pricing is heavily outperforming puts (CALL > 2 \times Put$). Dealers holding short calls are forced to buy underlying futures/shares to hedge, accelerating upward momentum.
cenario C: Downside Acceleration (Put Dump)
Dashboard Readout: MM Hedging Bias: ACCEL SELLING (PUT DUMP).
Chart Signal: Background flashes Red (Net premium crossed below zero).
Actionable Takeaway: Put pricing is surging relative to calls ( PUT > 2 \times Call$). Dealers hedging short puts are forced to sell stock/futures, increasing downside pressure.
It aggregates real-time OPRA option chain data inside Pine Script to display price movement, volatility decay, and order flow bias.
Key Features
Automated 0DTE Ticker Construction: Automatically generates OPRA option tickers for Call and Put options matching today's date ($YYMMDD$) in Eastern Time. Automatically handles the weekly root conversion for SPX (SPXW).
Intraday Premium Decay Tracking: Locks the 9:30 AM EST market open price to calculate percentage gain/loss (theta decay or volatility expansion) on the Call, the Put, and the combined Straddle price (
CALL + Put$).Market Maker Hedging Bias: Evaluates relative premium skew (
CALL - Put$) to categorize institutional dealer hedging pressure in real time (e.g., Accelerated Call Squeeze, Put Dump, or Neutral Chop).Visual Skew Flip Alerts: Highlights the chart background when net options premium crosses zero, signaling a shift in intraday dealer delta exposure.
Core Metrics Defined
Call / Put Premium: Live market price of individual legs. Identifies which side of the option chain is attracting aggressive buying.
Total Straddle: Combined value (
CALL + Put$). Tracks total implied move priced into the market for the current session.ol Regime: Evaluates total straddle decay vs. 9:30 AM open. Shows if options are undergoing THETA CRUSH ($<-20\%$) or VOL EXPANSION ($>+10\%$).
Net Premium (C - P): Dollar difference between Call and Put value. Crosses above/below zero signal real-time directional order flow shifts.
MM Hedging Bias: Dealer delta alignment based on premium ratio. Flags potential acceleration zones (squeezes/dumps) vs. range-bound chop.
How to Set Up and Use the Indicator
Step 1: Add to TradingView
Open TradingView and navigate to any chart.
Click the Pine Editor tab at the bottom of the screen.
Paste the Pine Script v6 code into the editor and click Save.
Click Add to Chart (the indicator runs in a separate panel below your main price chart).
Step 2: Configure Settings Each Morning
Open the indicator Settings gear icon:
Underlying Symbol: Choose QQQ, SPY, or SPX.
Strike Price: Enter the active At-The-Money (ATM) strike price near the market open (e.g., 760 for QQQ, 580 for SPY, 5800 for SPX).
DTE Expiry (YYMMDD): Leave blank to automatically select today's 0DTE date, or manually input a specific date (e.g., 261006 for Oct 6, 2026).
How to Interpret Signals in Live Trading
Scenario A: Theta Crush / Range-Bound Market
Dashboard Readout: Vol Regime: THETA CRUSH (Straddle down $>20\%$).
Flow State: MM Hedging Bias: NEUTRAL / CHOP.
Actionable Takeaway: Option sellers are draining extrinsic value. Expect price to stay pinned between key gamma levels. Long straddles/strangles will suffer heavy decay.
Scenario B: Momentum Expansion (Call Squeeze)
Dashboard Readout: MM Hedging Bias: ACCEL BUYING (CALL SQUEEZE).
Chart Signal: Background flashes Blue (Net premium crossed above zero).
Actionable Takeaway: Call pricing is heavily outperforming puts (
CALL > 2 \times Put$). Dealers holding short calls are forced to buy underlying futures/shares to hedge, accelerating upward momentum.cenario C: Downside Acceleration (Put Dump)
Dashboard Readout: MM Hedging Bias: ACCEL SELLING (PUT DUMP).
Chart Signal: Background flashes Red (Net premium crossed below zero).
Actionable Takeaway: Put pricing is surging relative to calls (
PUT > 2 \times Call$). Dealers hedging short puts are forced to sell stock/futures, increasing downside pressure.發行說明
cleaned up a few things 
免責聲明
這些資訊和出版物並非旨在提供,也不構成TradingView提供或認可的任何形式的財務、投資、交易或其他類型的建議或推薦。請閱讀使用條款以了解更多資訊。
免責聲明
這些資訊和出版物並非旨在提供,也不構成TradingView提供或認可的任何形式的財務、投資、交易或其他類型的建議或推薦。請閱讀使用條款以了解更多資訊。