OPEN-SOURCE SCRIPT
Pymander's EZ Trend Alignment
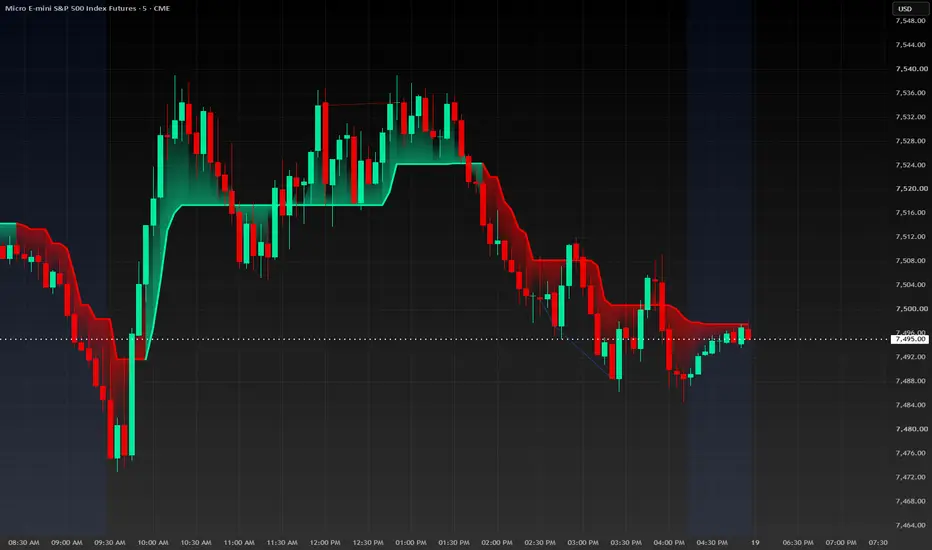
**Pymander’s EZ Trend Alignment** is a clean and easy-to-read trend-following indicator designed to help traders quickly identify bullish and bearish market direction.
The tool combines the Commodity Channel Index with an ATR-based trailing trend line. In simple terms, the CCI measures whether momentum favors buyers or sellers, while the ATR calculation adjusts the trend line to current market volatility.
When bullish momentum is present, the line trails beneath price and displays green. When bearish momentum takes control, the line moves above price and displays red. The trailing logic helps traders follow established trends while recognizing possible shifts in direction.
The indicator includes two coloring styles:
* **Original Coloring:** Changes color based directly on bullish or bearish CCI momentum.
* **Trend Coloring:** Changes color based on whether the trailing line is rising or falling.
Pymander’s EZ Trend Alignment may be used to confirm market direction, filter long and short setups, identify possible trend changes, follow directional moves, and avoid trading against established momentum.
Its strength is simplicity. Rather than cluttering the chart with unnecessary signals, it provides a clear visual guide to help traders determine whether price, momentum, and volatility are aligned.
As with any indicator, use it alongside proper risk management, market structure, and a tested trading plan. No indicator can guarantee profitable results.
Best of luck in the markets, traders. Stay patient, remain disciplined, and protect your capital.
— **Pymander**
The tool combines the Commodity Channel Index with an ATR-based trailing trend line. In simple terms, the CCI measures whether momentum favors buyers or sellers, while the ATR calculation adjusts the trend line to current market volatility.
When bullish momentum is present, the line trails beneath price and displays green. When bearish momentum takes control, the line moves above price and displays red. The trailing logic helps traders follow established trends while recognizing possible shifts in direction.
The indicator includes two coloring styles:
* **Original Coloring:** Changes color based directly on bullish or bearish CCI momentum.
* **Trend Coloring:** Changes color based on whether the trailing line is rising or falling.
Pymander’s EZ Trend Alignment may be used to confirm market direction, filter long and short setups, identify possible trend changes, follow directional moves, and avoid trading against established momentum.
Its strength is simplicity. Rather than cluttering the chart with unnecessary signals, it provides a clear visual guide to help traders determine whether price, momentum, and volatility are aligned.
As with any indicator, use it alongside proper risk management, market structure, and a tested trading plan. No indicator can guarantee profitable results.
Best of luck in the markets, traders. Stay patient, remain disciplined, and protect your capital.
— **Pymander**
開源腳本
秉持TradingView一貫精神,這個腳本的創作者將其設為開源,以便交易者檢視並驗證其功能。向作者致敬!您可以免費使用此腳本,但請注意,重新發佈代碼需遵守我們的社群規範。

免責聲明
這些資訊和出版物並非旨在提供,也不構成TradingView提供或認可的任何形式的財務、投資、交易或其他類型的建議或推薦。請閱讀使用條款以了解更多資訊。
免責聲明
這些資訊和出版物並非旨在提供,也不構成TradingView提供或認可的任何形式的財務、投資、交易或其他類型的建議或推薦。請閱讀使用條款以了解更多資訊。