OPEN-SOURCE SCRIPT
已更新 MJ Automatic Support and Resistance
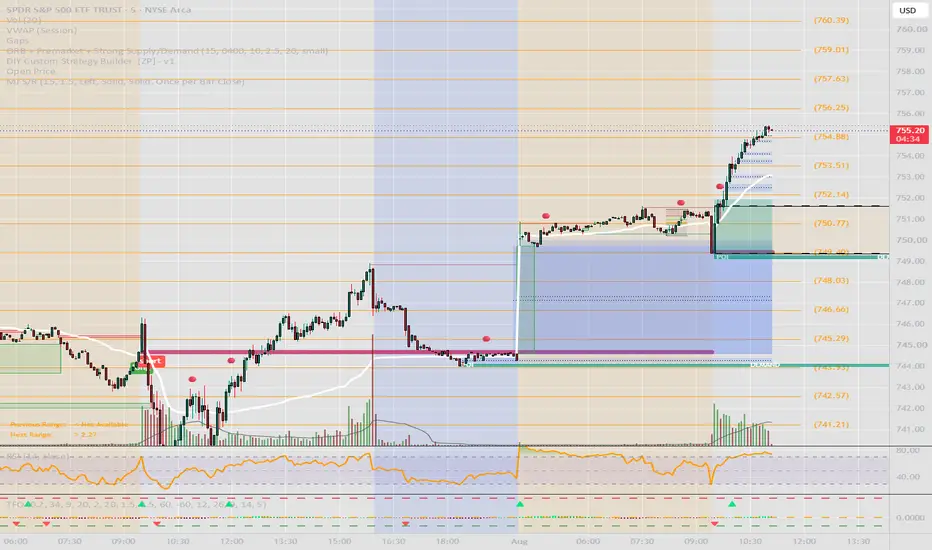
MJ Automatic Support & Resistance
MJ Automatic Support & Resistance is a chart-based indicator designed to automatically identify and display key support and resistance levels using confirmed pivot highs and pivot lows.
The indicator recalculates based on the active chart timeframe, so the levels automatically update when switching between intraday, daily, or higher timeframes.
Key Features
. Automatically detects support and resistance levels
. Works across all chart timeframes
. Uses confirmed pivot highs and lows
. Separate color controls for support and resistance
. Separate line-thickness controls for support and resistance
. Adjustable pivot sensitivity
. Optional merging of nearby levels
. Adjustable maximum number of displayed levels
. Minimum-touch filter for stronger levels
. Solid, dashed, and dotted line options
. Adjustable line transparency
. Optional price labels
. Optional removal of broken levels
. Adjustable ATR-based breakout confirmation buffer
. Ability to show or hide support and resistance independently
How It Works
Resistance levels are created from confirmed pivot highs, while support levels are created from confirmed pivot lows.
When multiple pivots form near the same price, the indicator can merge them into one level using an ATR-based distance filter. The level price is then averaged as additional touches are detected.
Users can also require a minimum number of touches before a level becomes visible, helping reduce weaker or less-tested levels.
Important Note
Pivot-based levels require future candles to confirm. Because of this, a new support or resistance level will appear only after the selected pivot-strength period has passed.
A higher Pivot Strength generally produces fewer but stronger levels. A lower Pivot Strength produces more levels and reacts faster to short-term price structure.
Suggested Settings
For a balanced chart:
Pivot Strength: 5
Maximum Levels: 30–50
Merge Nearby Levels: Enabled
Merge Distance: 0.20 ATR
Minimum Touches: 1–2
Support Thickness: 2
Resistance Thickness: 2
Lower pivot-strength settings may be more suitable for short-term trading, while higher settings may be better suited for swing trading and higher-timeframe analysis.
Disclaimer
This indicator is intended for technical analysis and educational purposes only. Support and resistance levels are not guaranteed to hold. Traders should combine the indicator with proper risk management, price action, volume, market structure, and other forms of confirmation before making trading decisions
MJ Automatic Support & Resistance is a chart-based indicator designed to automatically identify and display key support and resistance levels using confirmed pivot highs and pivot lows.
The indicator recalculates based on the active chart timeframe, so the levels automatically update when switching between intraday, daily, or higher timeframes.
Key Features
. Automatically detects support and resistance levels
. Works across all chart timeframes
. Uses confirmed pivot highs and lows
. Separate color controls for support and resistance
. Separate line-thickness controls for support and resistance
. Adjustable pivot sensitivity
. Optional merging of nearby levels
. Adjustable maximum number of displayed levels
. Minimum-touch filter for stronger levels
. Solid, dashed, and dotted line options
. Adjustable line transparency
. Optional price labels
. Optional removal of broken levels
. Adjustable ATR-based breakout confirmation buffer
. Ability to show or hide support and resistance independently
How It Works
Resistance levels are created from confirmed pivot highs, while support levels are created from confirmed pivot lows.
When multiple pivots form near the same price, the indicator can merge them into one level using an ATR-based distance filter. The level price is then averaged as additional touches are detected.
Users can also require a minimum number of touches before a level becomes visible, helping reduce weaker or less-tested levels.
Important Note
Pivot-based levels require future candles to confirm. Because of this, a new support or resistance level will appear only after the selected pivot-strength period has passed.
A higher Pivot Strength generally produces fewer but stronger levels. A lower Pivot Strength produces more levels and reacts faster to short-term price structure.
Suggested Settings
For a balanced chart:
Pivot Strength: 5
Maximum Levels: 30–50
Merge Nearby Levels: Enabled
Merge Distance: 0.20 ATR
Minimum Touches: 1–2
Support Thickness: 2
Resistance Thickness: 2
Lower pivot-strength settings may be more suitable for short-term trading, while higher settings may be better suited for swing trading and higher-timeframe analysis.
Disclaimer
This indicator is intended for technical analysis and educational purposes only. Support and resistance levels are not guaranteed to hold. Traders should combine the indicator with proper risk management, price action, volume, market structure, and other forms of confirmation before making trading decisions
發行說明
.....開源腳本
秉持TradingView一貫精神,這個腳本的創作者將其設為開源,以便交易者檢視並驗證其功能。向作者致敬!您可以免費使用此腳本,但請注意,重新發佈代碼需遵守我們的社群規範。

免責聲明
這些資訊和出版物並非旨在提供,也不構成TradingView提供或認可的任何形式的財務、投資、交易或其他類型的建議或推薦。請閱讀使用條款以了解更多資訊。
免責聲明
這些資訊和出版物並非旨在提供,也不構成TradingView提供或認可的任何形式的財務、投資、交易或其他類型的建議或推薦。請閱讀使用條款以了解更多資訊。