Futures Volume Session Lines - CFD Charts
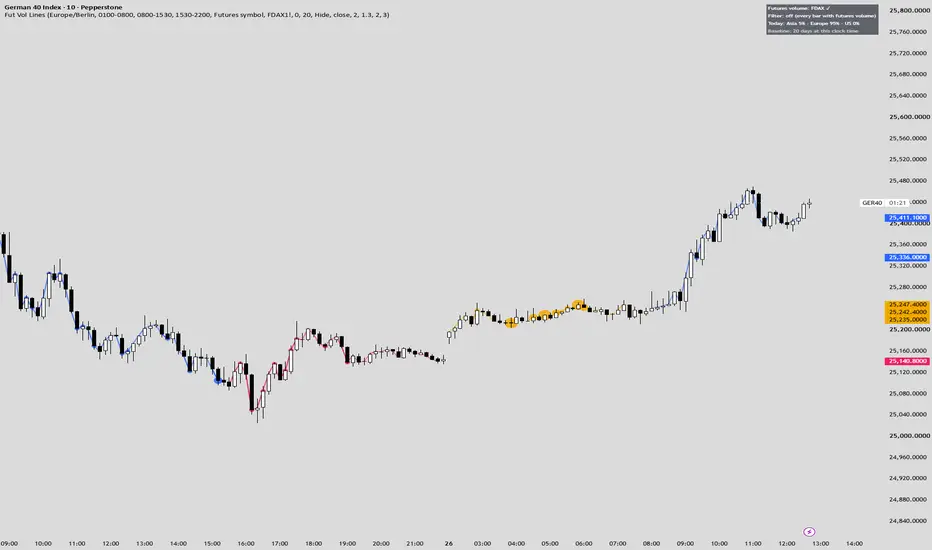
A line chart for CFDs that only draws price where real participation was: one line per session (Asia, Europe, US), shown where the matching futures contract traded and shaded by how heavy that volume was compared with the same time of day on earlier days.
What makes it original: a CFD prints prices around the clock, and its tick volume does not tell you which of those prices the exchange market actually traded. This script takes the volume of the futures contract instead and turns the price line into a participation map: solid where the future traded heavily, faint where it was thin, a gap where it did not trade at all. Volume is compared with the same clock time over the last days, so the opening and closing spikes are measured against earlier opens and closes, not against the quiet midday. Hide the chart's candles and it becomes a line chart of real participation.
How it works:
The futures contract is auto-detected from the chart symbol (DAX/GER40 -> FDAX, NAS100 -> NQ, US30 -> YM, UK100 -> Z, US500 -> ES), or set manually. On a native futures chart, switch the source to the chart's own volume.
Three sessions with their own times, colors and on/off switches, in one timezone (default Europe/Berlin: Asia 01:00-08:00, Europe 08:00-15:30, US 15:30-22:00). Where sessions overlap, the later one wins. Hours outside the sessions can be drawn as a fourth, gray line.
Relative volume: each bar's futures volume divided by the average volume of the same clock time over the lookback (default 20 days). A bar is compared with the days before it, never with itself. The first three days build the baseline; the table shows its progress.
Filter: show only bars from a chosen multiple of normal volume (0 = every bar on which the future traded). Bars below the filter are hidden or dimmed.
Volume bubbles: bars with above-normal volume get a bubble on the line in three sizes, small from 1.3x, medium from 2x and large from 3x normal by default. Lower the thresholds to see more bubbles, set the small one to 0 to turn them off.
Line opacity scales with relative volume: faint at 0x, medium at 1x, solid from 2x.
For a pure line chart, hide the chart's own candles: Chart settings > Symbol, untick Body, Borders and Wick. A script cannot hide the main series itself.
The table names the futures contract, the active filter, today's futures volume share per session, and the baseline depth at the current clock time.
How to use it: use it to see the day the way the exchange saw it. Moves drawn in a solid line happened with real participation, faint stretches happened in thin trading, and gaps are CFD prices without exchange volume behind them. With the filter at 1.0x, only the stretches with at least normal volume remain, which shows where each session actually did its business. It pairs well with a volume profile, which turns the same volume into price levels. The lines describe participation; they are not entry signals. Works on intraday timeframes up to 1 hour, where CFD and futures bars share their timestamps.
What makes it original: a CFD prints prices around the clock, and its tick volume does not tell you which of those prices the exchange market actually traded. This script takes the volume of the futures contract instead and turns the price line into a participation map: solid where the future traded heavily, faint where it was thin, a gap where it did not trade at all. Volume is compared with the same clock time over the last days, so the opening and closing spikes are measured against earlier opens and closes, not against the quiet midday. Hide the chart's candles and it becomes a line chart of real participation.
How it works:
The futures contract is auto-detected from the chart symbol (DAX/GER40 -> FDAX, NAS100 -> NQ, US30 -> YM, UK100 -> Z, US500 -> ES), or set manually. On a native futures chart, switch the source to the chart's own volume.
Three sessions with their own times, colors and on/off switches, in one timezone (default Europe/Berlin: Asia 01:00-08:00, Europe 08:00-15:30, US 15:30-22:00). Where sessions overlap, the later one wins. Hours outside the sessions can be drawn as a fourth, gray line.
Relative volume: each bar's futures volume divided by the average volume of the same clock time over the lookback (default 20 days). A bar is compared with the days before it, never with itself. The first three days build the baseline; the table shows its progress.
Filter: show only bars from a chosen multiple of normal volume (0 = every bar on which the future traded). Bars below the filter are hidden or dimmed.
Volume bubbles: bars with above-normal volume get a bubble on the line in three sizes, small from 1.3x, medium from 2x and large from 3x normal by default. Lower the thresholds to see more bubbles, set the small one to 0 to turn them off.
Line opacity scales with relative volume: faint at 0x, medium at 1x, solid from 2x.
For a pure line chart, hide the chart's own candles: Chart settings > Symbol, untick Body, Borders and Wick. A script cannot hide the main series itself.
The table names the futures contract, the active filter, today's futures volume share per session, and the baseline depth at the current clock time.
How to use it: use it to see the day the way the exchange saw it. Moves drawn in a solid line happened with real participation, faint stretches happened in thin trading, and gaps are CFD prices without exchange volume behind them. With the filter at 1.0x, only the stretches with at least normal volume remain, which shows where each session actually did its business. It pairs well with a volume profile, which turns the same volume into price levels. The lines describe participation; they are not entry signals. Works on intraday timeframes up to 1 hour, where CFD and futures bars share their timestamps.

免責聲明
這些資訊和出版物並非旨在提供,也不構成TradingView提供或認可的任何形式的財務、投資、交易或其他類型的建議或推薦。請閱讀使用條款以了解更多資訊。
免責聲明
這些資訊和出版物並非旨在提供,也不構成TradingView提供或認可的任何形式的財務、投資、交易或其他類型的建議或推薦。請閱讀使用條款以了解更多資訊。