OPEN-SOURCE SCRIPT
已更新 Custom Theme Breadth & Leadership Dashboard
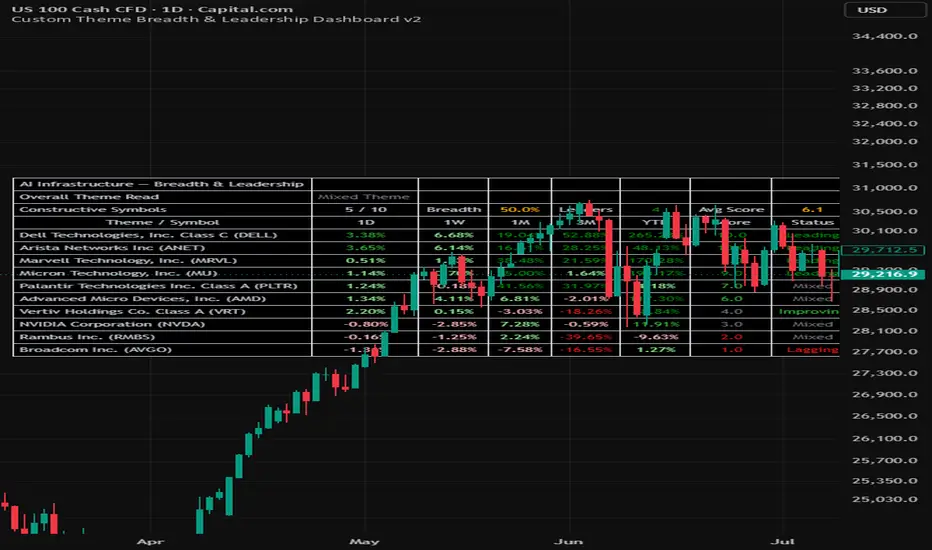
Custom Theme Breadth & Leadership Dashboard
This script is a customizable theme-breadth dashboard designed to help traders monitor whether a selected group of stocks or ETFs is showing broad participation, narrow leadership, mixed behaviour, or short-term weakness.
The main purpose of the script is to help traders avoid looking at one symbol in isolation. Many strong market moves happen through themes, sectors, or related groups of stocks. For example, AI infrastructure may include semiconductors, memory, networking, data-centre hardware, power infrastructure and cooling. This dashboard allows users to place related symbols into one basket and quickly see whether strength is broad-based or limited to only a few names.
The script is not a buy or sell signal. It is a decision-support tool for theme monitoring, sector rotation, watchlist review and relative leadership analysis.
What the dashboard shows
At the top of the table, the dashboard shows the overall condition of the selected basket:
Overall Theme Read
Constructive Symbols
Breadth %
Leaders
Average Score
Below the summary section, the table displays each selected symbol with the following columns:
1D: one-day rate of change
1W: five-trading-day rate of change
1M: twenty-one-trading-day rate of change
3M: sixty-three-trading-day rate of change
YTD: year-to-date rate of change
Score: a 0 to 10 participation score based on positive returns across multiple timeframes
Status: a short-term participation label based on recent performance behaviour
The score is designed to reward symbols that are positive across multiple timeframes. A symbol receives points for positive 1D, 1W, 1M, 3M and YTD performance, with additional bonus points for stronger 1W and 1M momentum.
Status definitions
Leading: 1W, 1M and 3M performance are all positive.
Improving: 1D and 1W are positive, but 1M is still negative.
Weakening: 1D and 1W are negative, but 3M is still positive.
Lagging: 1W and 1M are both negative.
Mixed: the symbol does not clearly fit into the other categories.
Important note on “Weakening”
A symbol can still be a strong longer-term leader and appear as “Weakening” if it has recently pulled back.
For example, a stock may have very strong 3M or YTD performance but still be classified as Weakening if its 1D and 1W performance are negative. This is intentional. The dashboard is designed to show current participation and short-term behaviour, not only long-term leadership quality.
Constructive Symbols
Constructive Symbols means the number of enabled symbols currently classified as either Leading or Improving.
This is a short-term participation measure. It does not mean that all other symbols are bad companies or poor long-term investments. It simply means they are not currently showing the short-term participation pattern required to be counted as constructive by this dashboard.
Breadth %
Breadth % shows the percentage of enabled symbols that are currently constructive.
For example, if the dashboard shows 2 / 10 and 20%, it means that 2 out of the 10 enabled symbols are currently classified as either Leading or Improving.
Leaders
Leaders shows how many enabled symbols are classified as Leading.
Average Score
Average Score shows the average score across all enabled symbols in the selected basket.
Overall Theme Read
The script converts the breadth and average score into an overall theme interpretation:
Broad Strength: many symbols in the basket are constructive and the average score is strong.
Narrow Leadership: the average score is strong, but breadth is not broad enough. This can mean only a few leaders are carrying the theme.
Mixed Theme: some symbols are working, but participation is uneven.
Weak Theme: few symbols are constructive and the group is not showing broad strength.
How to use
1. Choose Core Themes, Full Themes or Custom List mode.
2. In Custom List mode, enter the stocks or ETFs that represent the market theme you want to monitor.
3. Enable or disable symbols depending on your watchlist.
4. Use the Overall Theme Read to understand the condition of the basket.
5. Use Constructive Symbols and Breadth % to understand whether participation is broad or narrow.
6. Use the individual symbol rows to identify which names are leading, improving, weakening, lagging or mixed.
7. Use the dashboard together with your own chart analysis, support/resistance levels, volume, earnings dates and risk management.
Example use cases
A trader studying AI infrastructure could create a custom basket containing semiconductor, memory, networking, server, data-centre power and cooling names. If only one or two names are strong while the rest are weakening, the dashboard may show narrow leadership or a weak theme. If many names are leading or improving together, the dashboard may show broad strength.
A trader studying sector rotation could use the Core Themes or Full Themes modes to compare ETFs and identify where participation is improving or deteriorating.
Limitations
This script does not predict price movement.
It does not provide automatic buy or sell signals.
It does not replace individual chart analysis.
It does not account for earnings dates, company fundamentals, valuation or news.
A strong dashboard reading should still be confirmed with price structure, volume, market condition and risk management.
The script is designed to help traders quickly evaluate theme participation and leadership across a custom basket of symbols.
Sample snapshots


This script is a customizable theme-breadth dashboard designed to help traders monitor whether a selected group of stocks or ETFs is showing broad participation, narrow leadership, mixed behaviour, or short-term weakness.
The main purpose of the script is to help traders avoid looking at one symbol in isolation. Many strong market moves happen through themes, sectors, or related groups of stocks. For example, AI infrastructure may include semiconductors, memory, networking, data-centre hardware, power infrastructure and cooling. This dashboard allows users to place related symbols into one basket and quickly see whether strength is broad-based or limited to only a few names.
The script is not a buy or sell signal. It is a decision-support tool for theme monitoring, sector rotation, watchlist review and relative leadership analysis.
What the dashboard shows
At the top of the table, the dashboard shows the overall condition of the selected basket:
Overall Theme Read
Constructive Symbols
Breadth %
Leaders
Average Score
Below the summary section, the table displays each selected symbol with the following columns:
1D: one-day rate of change
1W: five-trading-day rate of change
1M: twenty-one-trading-day rate of change
3M: sixty-three-trading-day rate of change
YTD: year-to-date rate of change
Score: a 0 to 10 participation score based on positive returns across multiple timeframes
Status: a short-term participation label based on recent performance behaviour
The score is designed to reward symbols that are positive across multiple timeframes. A symbol receives points for positive 1D, 1W, 1M, 3M and YTD performance, with additional bonus points for stronger 1W and 1M momentum.
Status definitions
Leading: 1W, 1M and 3M performance are all positive.
Improving: 1D and 1W are positive, but 1M is still negative.
Weakening: 1D and 1W are negative, but 3M is still positive.
Lagging: 1W and 1M are both negative.
Mixed: the symbol does not clearly fit into the other categories.
Important note on “Weakening”
A symbol can still be a strong longer-term leader and appear as “Weakening” if it has recently pulled back.
For example, a stock may have very strong 3M or YTD performance but still be classified as Weakening if its 1D and 1W performance are negative. This is intentional. The dashboard is designed to show current participation and short-term behaviour, not only long-term leadership quality.
Constructive Symbols
Constructive Symbols means the number of enabled symbols currently classified as either Leading or Improving.
This is a short-term participation measure. It does not mean that all other symbols are bad companies or poor long-term investments. It simply means they are not currently showing the short-term participation pattern required to be counted as constructive by this dashboard.
Breadth %
Breadth % shows the percentage of enabled symbols that are currently constructive.
For example, if the dashboard shows 2 / 10 and 20%, it means that 2 out of the 10 enabled symbols are currently classified as either Leading or Improving.
Leaders
Leaders shows how many enabled symbols are classified as Leading.
Average Score
Average Score shows the average score across all enabled symbols in the selected basket.
Overall Theme Read
The script converts the breadth and average score into an overall theme interpretation:
Broad Strength: many symbols in the basket are constructive and the average score is strong.
Narrow Leadership: the average score is strong, but breadth is not broad enough. This can mean only a few leaders are carrying the theme.
Mixed Theme: some symbols are working, but participation is uneven.
Weak Theme: few symbols are constructive and the group is not showing broad strength.
How to use
1. Choose Core Themes, Full Themes or Custom List mode.
2. In Custom List mode, enter the stocks or ETFs that represent the market theme you want to monitor.
3. Enable or disable symbols depending on your watchlist.
4. Use the Overall Theme Read to understand the condition of the basket.
5. Use Constructive Symbols and Breadth % to understand whether participation is broad or narrow.
6. Use the individual symbol rows to identify which names are leading, improving, weakening, lagging or mixed.
7. Use the dashboard together with your own chart analysis, support/resistance levels, volume, earnings dates and risk management.
Example use cases
A trader studying AI infrastructure could create a custom basket containing semiconductor, memory, networking, server, data-centre power and cooling names. If only one or two names are strong while the rest are weakening, the dashboard may show narrow leadership or a weak theme. If many names are leading or improving together, the dashboard may show broad strength.
A trader studying sector rotation could use the Core Themes or Full Themes modes to compare ETFs and identify where participation is improving or deteriorating.
Limitations
This script does not predict price movement.
It does not provide automatic buy or sell signals.
It does not replace individual chart analysis.
It does not account for earnings dates, company fundamentals, valuation or news.
A strong dashboard reading should still be confirmed with price structure, volume, market condition and risk management.
The script is designed to help traders quickly evaluate theme participation and leadership across a custom basket of symbols.
Sample snapshots
發行說明
Saved Theme Presets & Simplified Symbol SetupThis update improves the workflow for users who monitor multiple custom market themes.
**What's new**
* Added 5 independent Saved Theme Presets.
* Each preset supports up to 15 user-selected symbols.
* Each preset has its own editable theme name.
* Users can quickly switch between saved baskets without rebuilding the Custom List each time.
* Simplified custom symbol setup: users now only need to select the TradingView symbol.
* Company/instrument name and ticker label are retrieved automatically from the selected symbol.
* Dashboard header now reflects the selected saved theme.
* Existing Core Themes and Full Themes modes remain available.
* Existing Breadth, Leadership, Score, Status and Overall Theme Read calculations remain unchanged.
This update is intended to make the dashboard more practical for traders monitoring multiple thematic baskets, such as AI Infrastructure, Hyperscalers, Cybersecurity, Biotech or other custom groups.
開源腳本
秉持TradingView一貫精神,這個腳本的創作者將其設為開源,以便交易者檢視並驗證其功能。向作者致敬!您可以免費使用此腳本,但請注意,重新發佈代碼需遵守我們的社群規範。

免責聲明
這些資訊和出版物並非旨在提供,也不構成TradingView提供或認可的任何形式的財務、投資、交易或其他類型的建議或推薦。請閱讀使用條款以了解更多資訊。
免責聲明
這些資訊和出版物並非旨在提供,也不構成TradingView提供或認可的任何形式的財務、投資、交易或其他類型的建議或推薦。請閱讀使用條款以了解更多資訊。