OPEN-SOURCE SCRIPT
Customized Double Bollinger Bands [wjdtks255]
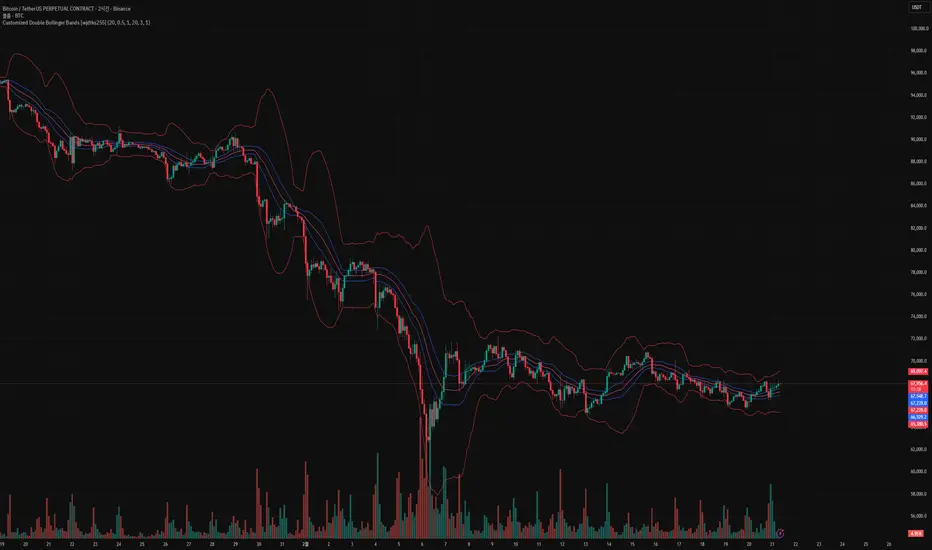
■ Technical Overview
The Customized Double Bollinger Bands is a multi-layered volatility analysis framework. Unlike standard single-band indicators, this script synchronizes two independent volatility engines to identify both the "Value Area" (Band 1) and "Extreme Volatility Zones" (Band 2) simultaneously on a single interface.
■ Implementation & Logic
Dual-Deviation Synchronization: The script calculates two distinct standard deviation layers ($StdDev_{0.5}$ and $StdDev_{3.0}$) to provide a high-fidelity view of price distribution.
Dynamic Range Compression: By comparing the gap between the Blue (Inner) and Red (Outer) bands, traders can visually identify "Squeeze" and "Expansion" phases with institutional-grade precision.
■ Key Features
Fully Customizable Layers: Independent control over 'Length', 'StdDev', and 'Color' for both band sets allows for adaptive strategies across different timeframes.
Optimized Visual Clarity: Designed with specific line-width controls to ensure the chart remains readable even during high-volatility spikes.
■ Trading Method
Core Trend: Use the Inner Blue Bands ($0.5$ StdDev) to track the primary trend strength.
Reversal Watch: Use the Outer Red Bands ($3.0$ StdDev) as exhaustion points where price is statistically overextended.
The Customized Double Bollinger Bands is a multi-layered volatility analysis framework. Unlike standard single-band indicators, this script synchronizes two independent volatility engines to identify both the "Value Area" (Band 1) and "Extreme Volatility Zones" (Band 2) simultaneously on a single interface.
■ Implementation & Logic
Dual-Deviation Synchronization: The script calculates two distinct standard deviation layers ($StdDev_{0.5}$ and $StdDev_{3.0}$) to provide a high-fidelity view of price distribution.
Dynamic Range Compression: By comparing the gap between the Blue (Inner) and Red (Outer) bands, traders can visually identify "Squeeze" and "Expansion" phases with institutional-grade precision.
■ Key Features
Fully Customizable Layers: Independent control over 'Length', 'StdDev', and 'Color' for both band sets allows for adaptive strategies across different timeframes.
Optimized Visual Clarity: Designed with specific line-width controls to ensure the chart remains readable even during high-volatility spikes.
■ Trading Method
Core Trend: Use the Inner Blue Bands ($0.5$ StdDev) to track the primary trend strength.
Reversal Watch: Use the Outer Red Bands ($3.0$ StdDev) as exhaustion points where price is statistically overextended.
開源腳本
秉持TradingView一貫精神,這個腳本的創作者將其設為開源,以便交易者檢視並驗證其功能。向作者致敬!您可以免費使用此腳本,但請注意,重新發佈代碼需遵守我們的社群規範。

免責聲明
這些資訊和出版物並非旨在提供,也不構成TradingView提供或認可的任何形式的財務、投資、交易或其他類型的建議或推薦。請閱讀使用條款以了解更多資訊。
免責聲明
這些資訊和出版物並非旨在提供,也不構成TradingView提供或認可的任何形式的財務、投資、交易或其他類型的建議或推薦。請閱讀使用條款以了解更多資訊。