Linear Regression + Moving Average
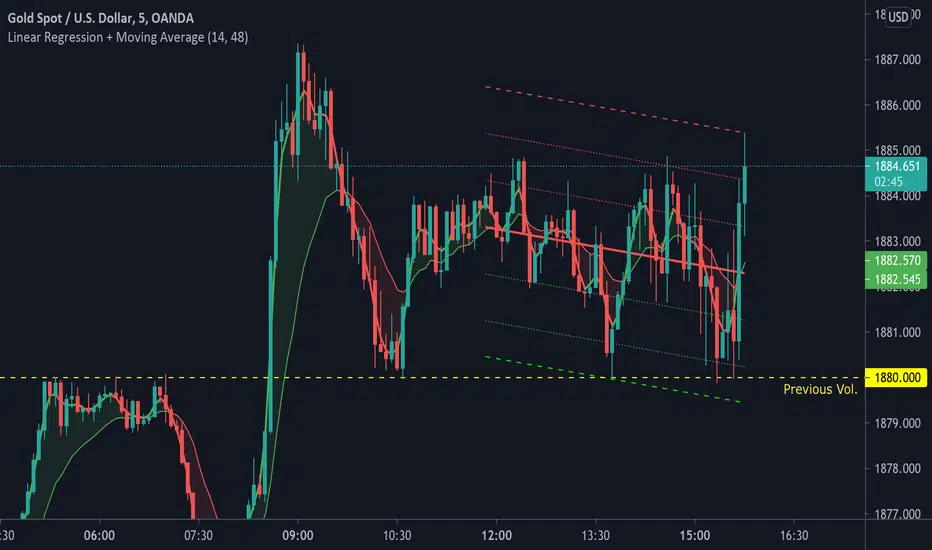
1. Linear Regression including 2 x Standard Deviation + High / Low. Middle line colour depends on colour change of Symmetrically Weighted Moving Average [2]. Green zones indicate good long positions. Red zones indicate good short positions. (Custom)
2. Symmetrically Weighted Moving Average. Colour change depending on cross of offset -1. (Fixed)
3. Exponentially Weighted Moving Average. Colour change depending on cross with Symmetrically Weighted Moving Average. (Custom)
2. Symmetrically Weighted Moving Average. Colour change depending on cross of offset -1. (Fixed)
3. Exponentially Weighted Moving Average. Colour change depending on cross with Symmetrically Weighted Moving Average. (Custom)

免責聲明
這些資訊和出版物並非旨在提供,也不構成TradingView提供或認可的任何形式的財務、投資、交易或其他類型的建議或推薦。請閱讀使用條款以了解更多資訊。
免責聲明
這些資訊和出版物並非旨在提供,也不構成TradingView提供或認可的任何形式的財務、投資、交易或其他類型的建議或推薦。請閱讀使用條款以了解更多資訊。