OPEN-SOURCE SCRIPT
已更新 Big Order Candle Detector
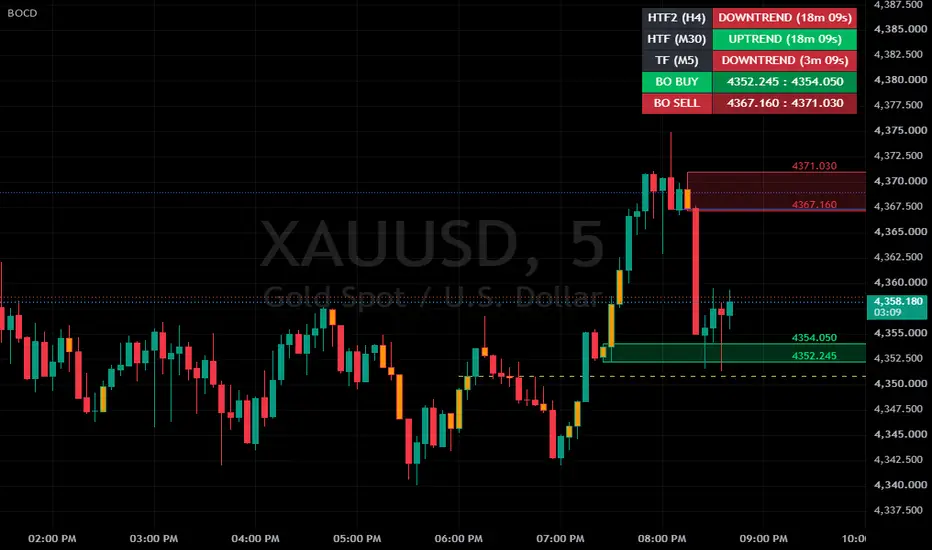
Big Order Candle Detector (BOCD) – Explanation & Usage
The Big Order Candle Detector (BOCD) is an indicator designed to identify potential large institutional order activity in the market. It focuses on detecting strong price displacement, which may signal the early stage of a trend.
This structure allows the indicator to capture moments where price moves aggressively, often without overlap with previous price ranges. Such behavior can indicate the presence of strong buying or selling pressure.
How Big Order is Detected
A Bullish Big Order is identified when the current candle’s low is higher than the high of Candle A. This indicates a clear gap or displacement upward, suggesting strong buying interest.
A Bearish Big Order, on the other hand, occurs when the current candle’s high is lower than the low of Candle A, reflecting strong downward pressure.
To reduce noise, the script only marks the first Big Order signal when multiple signals appear consecutively. This ensures cleaner and more meaningful signals.
Visual Representation on Chart
The indicator provides several visual elements to assist analysis:
Triangle Signals
Green triangle → Bullish Big Order
Red triangle → Bearish Big Order
→ Represents early momentum or possible trend initiation
Highlighted Candle (Orange)
→ Considered the origin of the move or liquidity zone
Support & Resistance Box
Drawn based on the high and low of Candle A
→ Acts as a reaction zone for future price movement
Strategy & How to Use
This indicator is best used as a supporting tool for price action analysis, not as a standalone trading signal.
BUY Scenario (Bullish Setup)
When a bullish Big Order appears, it suggests that strong buying momentum has entered the market. Instead of entering immediately, traders typically wait for price to retrace.
Approach:
Wait for price to pull back into the support box, Look for confirmation signals before entering
Confirmation Examples:
Bullish candlestick pattern (e.g., engulfing, pin bar)
Minor break of structure
Increase in volume
Trade Plan:
Entry: Inside the support box (after confirmation)
Take Profit: Nearest resistance zone or previous high
Stop Loss: Below the support box
SELL Scenario (Bearish Setup)
In a bearish setup, the indicator signals strong selling pressure. Similar to the bullish case, traders wait for a retracement rather than chasing the move.
Approach:
Wait for price to move back into the resistance box, Look for signs of rejection
Confirmation Examples:
Bearish rejection candle
Formation of lower high
Weak bullish momentum
Trade Plan:
Entry: Inside the resistance box (after confirmation)
Take Profit: Nearest support zone
Stop Loss: Above the resistance box
Key Concept Summary
Big Order = Strong displacement (possible institutional activity)
Triangle = Signal of momentum
Orange Candle = Origin zone
Box = Key support/resistance area
Retracement = Entry opportunity
Confirmation = Risk control
Important Considerations
This indicator:
In practice, BOCD works best as:
A decision-support tool to identify high-probability zones, rather than a direct buy/sell system.
The Big Order Candle Detector (BOCD) is an indicator designed to identify potential large institutional order activity in the market. It focuses on detecting strong price displacement, which may signal the early stage of a trend.
This structure allows the indicator to capture moments where price moves aggressively, often without overlap with previous price ranges. Such behavior can indicate the presence of strong buying or selling pressure.
How Big Order is Detected
A Bullish Big Order is identified when the current candle’s low is higher than the high of Candle A. This indicates a clear gap or displacement upward, suggesting strong buying interest.
A Bearish Big Order, on the other hand, occurs when the current candle’s high is lower than the low of Candle A, reflecting strong downward pressure.
To reduce noise, the script only marks the first Big Order signal when multiple signals appear consecutively. This ensures cleaner and more meaningful signals.
Visual Representation on Chart
The indicator provides several visual elements to assist analysis:
Triangle Signals
Green triangle → Bullish Big Order
Red triangle → Bearish Big Order
→ Represents early momentum or possible trend initiation
Highlighted Candle (Orange)
→ Considered the origin of the move or liquidity zone
Support & Resistance Box
Drawn based on the high and low of Candle A
→ Acts as a reaction zone for future price movement
Strategy & How to Use
This indicator is best used as a supporting tool for price action analysis, not as a standalone trading signal.
BUY Scenario (Bullish Setup)
When a bullish Big Order appears, it suggests that strong buying momentum has entered the market. Instead of entering immediately, traders typically wait for price to retrace.
Approach:
Wait for price to pull back into the support box, Look for confirmation signals before entering
Confirmation Examples:
Bullish candlestick pattern (e.g., engulfing, pin bar)
Minor break of structure
Increase in volume
Trade Plan:
Entry: Inside the support box (after confirmation)
Take Profit: Nearest resistance zone or previous high
Stop Loss: Below the support box
SELL Scenario (Bearish Setup)
In a bearish setup, the indicator signals strong selling pressure. Similar to the bullish case, traders wait for a retracement rather than chasing the move.
Approach:
Wait for price to move back into the resistance box, Look for signs of rejection
Confirmation Examples:
Bearish rejection candle
Formation of lower high
Weak bullish momentum
Trade Plan:
Entry: Inside the resistance box (after confirmation)
Take Profit: Nearest support zone
Stop Loss: Above the resistance box
Key Concept Summary
Big Order = Strong displacement (possible institutional activity)
Triangle = Signal of momentum
Orange Candle = Origin zone
Box = Key support/resistance area
Retracement = Entry opportunity
Confirmation = Risk control
Important Considerations
This indicator:
- Does not guarantee winning trades
- Should not be used alone
- Always combine with:
- Risk management
- Market structure analysis
- Additional confirmation tools
In practice, BOCD works best as:
A decision-support tool to identify high-probability zones, rather than a direct buy/sell system.
發行說明
Code Optimize & Fixed:- Added Strong / Weak Big Order box classification.
- Strong BigO now detects breakout above active Higher High or below active Lower Low.
- Added Higher High close line based on bullish candle followed by bearish candle.
- Added Lower Low close line based on bearish candle followed by bullish candle.
- Added box history limit to control how many BigO zones are displayed.
- Added HH / LL line history limit to keep chart cleaner.
- Added forward projection setting for HH / LL lines.
- Improved Strong and Weak box colors for clearer visual separation.
- Preserved original BigO detection logic and consecutive BigO filtering.
- Optimized object handling using arrays for boxes and lines.
發行說明
BIG ORDER CANDLE DETECTOR (BOCD) — v2.0A major update to the Big Order Candle Detector. The original release focused on detecting the 3-candle Big Order gap and marking it with a static zone. This version rebuilds the zone engine around zone lifecycle tracking, adds a multi-timeframe trend framework with an on-chart dashboard, and introduces alerting.
HIGHLIGHTS
Zones now live until price actually invalidates them — and extend to the right edge of the screen while they do.
- Every qualifying Big Order candle is detected, not only the first of a series.
- New multi-timeframe trend engine with automatic Higher-Timeframe (HTF) pairing.
- New on-chart status dashboard: HTF trend, current-TF trend, live candle countdowns, and active BUY/SELL zone ranges.
- New alert on HTF trend reversal.
ZONE RENDERING
- Zone borders redrawn as top and bottom levels only. The vertical left/right edges are removed, so zones read as support/resistance bands rather than closed rectangles.
- Configurable top/bottom line width.
- Strong/Weak zone classification removed. Zones are now differentiated by direction only — Buy (bullish Big Order) and Sell (bearish Big Order) — each with independent fill, border, and dashboard colors.
- Price labels added at the high and low of each zone, with a selectable label size (Auto / Tiny / Small / Normal / Large / Huge).
- New Price Label Forward Offset control pushes price labels into the empty space to the right of the last candle, keeping them clear of price action.
ZONE LIFECYCLE
- Zones are no longer fixed-length. A zone extends indefinitely and is only closed once price has broken BOTH its top and its bottom.
- Break detection is cumulative and independent per side: the top and the bottom may be broken on different candles, in any order. The zone freezes at the exact bar where the second side is broken.
- Active zones use native right-extension, so they always reach the right edge of the viewport regardless of zoom or scroll level. On invalidation, extension is disabled and the zone is pinned to its break bar as a permanent record.
- Break evaluation is gated to confirmed bars only, preventing false invalidation from intrabar noise. Zone positioning, by contrast, updates on every tick — this removes the one-bar trailing gap that became visible at high horizontal zoom in the previous build.
ZONE MANAGEMENT
- Detection now marks every candle that satisfies the Big Order condition. The previous "first gap in a consecutive series only" restriction has been removed, so no valid setup is skipped.
- New Max Active Box control applies a per-direction FIFO limit across a single combined list of active and closed zones. When the cap is exceeded for a direction, the oldest zone for that direction is removed regardless of state. Buy and Sell counts are tracked separately.
- New dynamic display mode: only the most recent not-yet-invalidated zone is rendered per direction. Older zones are hidden but continue to be tracked in the background, so they reappear correctly positioned if they become the current zone again.
MULTI-TIMEFRAME TREND ENGINE (NEW)
- Automatic higher-timeframe pairing based on the active chart timeframe: M1→M15, M5→M30, M15→H1, M30→H4, H1→D1, H4→W1, D1→MN.
- Trend state is derived from a structure-and-breakout model rather than a simple close comparison: – UPTREND is confirmed after a Higher High forms (bullish candle followed by a bearish candle, with the HH level taken at the bullish candle's close) and a subsequent candle closes above that HH level. – DOWNTREND is confirmed after a Lower Low forms (bearish candle followed by a bullish candle, LL level at the bearish candle's close) and a subsequent candle closes below that LL level.
- Trend state is persistent and only re-evaluated on closed candles of the timeframe being measured. HTF status therefore holds steady for the full duration of the forming HTF candle instead of flipping on every chart tick.
- All higher-timeframe requests use non-repainting settings.
- The same trend model is evaluated independently on the current chart timeframe, allowing direct HTF-versus-LTF alignment checks. The two states are tracked separately and never share levels.
ON-CHART DASHBOARD (NEW)
A compact status table with configurable corner position (Top/Bottom × Left/Right) and text size:
HTF (H1) | UPTREND (13m 52s)
TF (M15) | DOWNTREND (1m 52s)
BO BUY | 4633.53 : 4642.11
BO SELL | 4651.53 : 4658.23
- Rows 1–2: trend state for the paired higher timeframe and for the current chart timeframe, each with a live countdown to that timeframe's candle close. Cell background is color-coded to the trend direction.
- Rows 3–4: low-to-high range of the currently active Buy and Sell zones, shown simultaneously and color-matched to their respective zones.
- The table renders on the last bar only, keeping overhead minimal.
ALERTS (NEW)
- Single Enable Alert on HTF Direction Change toggle covering both directions.
- Fires once per confirmed bar close on a genuine state change, with a guard against a spurious first-bar trigger on load.
- Dynamic message includes symbol, chart timeframe, paired HTF, and the transition itself: BOCD | XAUUSD (15) | Trend HTF H1 changed: DOWNTREND -> UPTREND
- Set up via the alarm icon → select "Big Order Candle Detector" → "Any alert() function call".
STABILITY
- Fixed a runtime error that could halt the script on the first bar ("Index 0 is out of bounds, array size is 0"). All collection iteration was migrated to explicitly bounded loops, eliminating an edge case where an empty collection produced a single out-of-range access.
- Replaced unreliable transparency handling when hiding existing drawing objects, resolving cases where hidden price labels could remain visible and overlap the active zone's labels.
DEFAULT SETTINGS CHANGES
- Big Order Triangle markers: now OFF by default.
- Higher High / Lower Low lines: now OFF by default.
- Max Active Box: 100 per direction.
Both display options remain fully available and can be re-enabled in settings. Users upgrading from the previous version should note that saved indicator templates may retain old defaults; re-adding the indicator applies the new ones.
PERFORMANCE NOTE
Max Active Box defaults to 100 per direction. Lowering this value reduces the number of tracked drawing objects and improves recalculation frequency, which in turn makes the dashboard countdowns update more smoothly. Pine Script has no internal timer — countdown values refresh only when new price data arrives, so they may appear to pause during quiet market conditions.
發行說明
BIG ORDER CANDLE DETECTOR (BOCD) — v2.1 UPDATE NOTES====================================================
NEW
---
• Consecutive Big Order handling. New "Box Bila BigO Berturutan" setting with
three modes:
All – draw every zone in the series
Latest – keep only the most recent zone of the series
First – keep only the first zone of the series (default)
A series is defined as consecutive Big Order signals in the same direction. A
change of direction starts a new series.
• Second higher timeframe (HTF2) added to the dashboard. HTF2 is derived by
applying the same timeframe pairing table twice — for example, an M1 chart
gives HTF M15 and HTF2 H1. Dashboard rows are now ordered from the highest
timeframe down to the chart timeframe.
• Alerts reworked around trade setups instead of trend flips. An alert now
requires two conditions at the same time: trend alignment, and a new zone
forming in that same direction.
• New "Syarat Trend Untuk Alert" setting controls which trend is evaluated for
alerts: HTF only (default), TF only, HTF or TF, HTF and TF.
CHANGED
-------
• Zone invalidation is now body-based. A side of the zone counts as broken only
when a candle CLOSES beyond that level. Wicks that pierce the level but close
back inside the zone no longer invalidate it. The previous build used
high/low, so any wick touch was enough.
Effect: zones stay valid longer, most noticeably on instruments that print
long wicks. Expect more zones active at once — adjust Max Active Box if the
chart gets crowded.
• Both sides must still be closed through before a zone is invalidated, tracked
independently and cumulatively across any number of bars, in any order.
HARDENED
--------
• In Latest mode, the zone being replaced is now verified by both creation bar
and direction before removal. This prevents an unrelated zone being deleted
when Max Active Box is set to a very low value.
DEFAULT SETTINGS
----------------
• Box Bila BigO Berturutan: First
• Syarat Trend Untuk Alert: HTF only
• Enable Alert Setup BO: off
Note: charts with a saved instance of the indicator keep their previous input
values. Re-add the indicator to pick up the new defaults.
發行說明
BIG ORDER CANDLE DETECTOR (BOCD) — UPDATE NOTES===============================================
FIXED
-----
• Zones could stay valid forever and block the zone fallback.
The invalidation check runs before zones are created on each bar, so the Big
Order candle itself — the candle that gaps clear of the zone and defines the
setup — was never evaluated. That side of the zone was therefore never
recorded as broken, and because invalidation requires both sides, the zone
never closed out. Being the most recent zone, it also kept older valid zones
from being displayed.
Zones now record the gap side at creation. Net behaviour:
SELL zone is invalidated when a candle CLOSES back above its top.
BUY zone is invalidated when a candle CLOSES back below its bottom.
As a result, once a zone is invalidated the display correctly falls back to
the most recent zone that is still valid, stepping further back as needed.
NEW
---
• "Paparan Dinamik (Satu Box Setiap Arah)" toggle. On by default — one zone per
direction. Turn it off to display every zone, including invalidated ones.
• "Kaedah Undur Box Bila Batal" setting controls how older zones are evaluated:
Reset Bila Ambil Alih (default) – only the displayed zone is tracked; an
older zone is re-evaluated from the bar it takes over, so past price
action does not consume it in the background.
Jejak Semua Serentak – every zone is tracked at all times; zones already
closed out by price are skipped.
• "Box Bila BigO Berturutan" setting for consecutive same-direction signals:
All / Latest / First (default: First)
• Second higher timeframe (HTF2) added to the dashboard, derived by applying
the timeframe pairing table twice (M1 → M15 → H1). Dashboard rows now run
from the highest timeframe down to the chart timeframe.
• Alerts reworked around trade setups: an alert requires trend alignment plus a
new zone forming in that same direction. New "Syarat Trend Untuk Alert"
setting — HTF only (default), TF only, HTF or TF, HTF and TF.
CHANGED
-------
• Zone invalidation is body-based. A side counts as broken only when a candle
CLOSES beyond that level; wicks piercing the level no longer invalidate the
zone. The previous build used high/low, so any wick touch was enough.
發行說明
NEWSupertrend added, calculated on the chart timeframe and drawn as a line. Defaults are factor 4.5 and ATR period 14 — chosen after comparing settings on XAUUSD M1, where the common 3/10 broke strong trends into many segments and would have signalled the opposite direction mid-move. Colours, width, factor and ATR period are all adjustable, and the line can be switched off. The line breaks cleanly at each flip rather than drawing a vertical jump.
CHANGED — BREAK-OUT LINES
The Higher High / Lower Low lines have been replaced by a single BO (break-out) line per timeframe, drawn for the chart timeframe, HTF and HTF2.
The line is now drawn on the BREAK, not on the pattern. A Higher High or Lower Low level is recorded when it forms but stays hidden; only when a candle closes beyond that level does the line appear — placed at the level that was broken. It then holds that position until the next break.
Display standard: Colour — break type: HH break = yellow, LL break = blue Style — timeframe: chart TF = solid, HTF = dashed, HTF2 = dotted
Each timeframe's line has its own on/off switch.
Removed with the old behaviour: "Show Higher High / Lower Low Line", "Line Forward Bars" and "Line History Limit". Only three line objects are now kept for the life of the chart instead of one per pattern.
CHANGED — ALERTS
Alerts now fire on a retest of the break-out line rather than on a new zone forming. After a HH break the line sits below price and the alert fires when price comes back down and touches it; after a LL break the line sits above price and the alert fires when price comes back up to it.
The trigger uses the candle's high and low, so it fires the moment price touches the level — it does not wait for the candle to close.
Separate switches for chart TF, HTF and HTF2.
Each break produces at most one alert. The alert re-arms only when a new break sets a new level, and the breaking candle itself cannot trigger a retest, so a wick that is still resting on the level does not fire.
Replaced by the above: "Enable Alert Setup BO" and "Syarat Trend Untuk Alert". The new alert does not apply a trend filter.
FIXED
Corrected unreliable historical references in the trend engine. Two candle-direction variables were declared inside a conditional block, so their previous-bar values could not be trusted on the forming candle. Both are now evaluated on every bar, which makes Higher High / Lower Low detection dependable in real time.
發行說明
CHANGEDThe BO break-out level is now drawn as a horizontal RAY instead of a full horizontal line. It no longer stretches across the whole chart — it starts at a fixed point and extends to the right only.
The ray starts at the Higher High / Lower Low candle that formed the level, not at the candle that broke it. This makes it clear at a glance where the level came from.
Rays for HTF and HTF2 are anchored by timestamp rather than bar position, so a level taken from a higher timeframe lands on the correct candle on the chart you are viewing, whatever timeframe that is.
DOCUMENTATION
Added a warning to all three alert toggles: TradingView stores a copy of the indicator's settings at the moment an alert is created, so changing a toggle does NOT affect an alert that is already running. After changing any alert setting, delete the alert and create it again. Best practice: set every option the way you want it first, then create the alert.
開源腳本
秉持TradingView一貫精神,這個腳本的創作者將其設為開源,以便交易者檢視並驗證其功能。向作者致敬!您可以免費使用此腳本,但請注意,重新發佈代碼需遵守我們的社群規範。

免責聲明
這些資訊和出版物並非旨在提供,也不構成TradingView提供或認可的任何形式的財務、投資、交易或其他類型的建議或推薦。請閱讀使用條款以了解更多資訊。
免責聲明
這些資訊和出版物並非旨在提供,也不構成TradingView提供或認可的任何形式的財務、投資、交易或其他類型的建議或推薦。請閱讀使用條款以了解更多資訊。