Previous Day, Week & Month Levels [ITA]
🟠 OVERVIEW
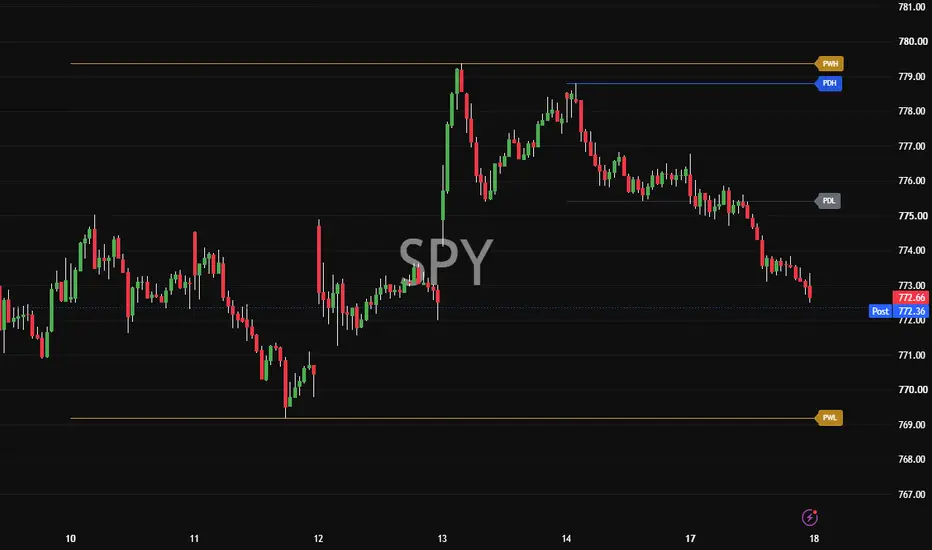
Previous Day, Week & Month Levels plots the high and low of each completed higher timeframe period and keeps them on the chart until price trades through them. Once a level is taken, it fades to grey instead of disappearing, so the chart separates liquidity that is still resting from liquidity that has already been collected.
The indicator covers daily, weekly and monthly periods independently, with optional midpoints for each range. This lets an intraday trader run daily levels alone, or stack all three groups to see how short-term and higher timeframe references line up.
🟠 CONCEPTS
* Previous Level - The high or low of the last completed daily, weekly or monthly candle, pulled from the higher timeframe regardless of the chart timeframe in use.
* Untaken Level - A level that price has not traded through since its period closed. Drawn at full opacity because the orders resting behind it are still there.
* Taken Level - A level that price has traded through during the current period. Recolored grey to show the liquidity has been collected and the level has lost its role as a target.
* Level Reset - Each group tracks its own taken state and resets when a new period begins. Daily flags clear every session while weekly and monthly flags run on their own cycles.
* Midpoint - The 50% level of a previous range, marking the equilibrium of that period rather than its extremes.
🟠 FEATURES
* Multi-Period Levels - Plots previous day, week and month highs and lows, each group toggleable on its own.
* Taken Level Fading - Automatically recolors any level that price trades through, leaving untouched levels highlighted.
* Optional Midpoints - Adds the 50% level of each enabled range for equilibrium reference.
* Level Labels - Tags each line with its name on the right edge of the chart, with configurable size.
* Level Alerts - Fires when price trades above a previous high or below a previous low.
🟠 HOW TO USE
* Run daily levels alone for intraday work, or enable weekly and monthly for a broader structural view.
* Treat bright levels as unfinished business and faded levels as history. What stays highlighted is where liquidity has not yet been taken.
* Watch for clusters where a daily level sits close to a weekly one. A single move that clears both tends to produce a sharper reaction than clearing either alone.
* Use midpoints as a filter. Price rotating around the midpoint of the previous day often points to balance rather than direction.
* Adjust Extend Right if the levels project too far past the current candle or stop short of it.
🟠 CONCLUSION
Previous Day, Week & Month Levels combines multi-period reference levels with automatic tracking of which levels have already been traded through. Instead of showing every level identically, it separates active liquidity from collected liquidity, giving traders a clear view of which reference points are still relevant to the current session.
Previous Day, Week & Month Levels plots the high and low of each completed higher timeframe period and keeps them on the chart until price trades through them. Once a level is taken, it fades to grey instead of disappearing, so the chart separates liquidity that is still resting from liquidity that has already been collected.
The indicator covers daily, weekly and monthly periods independently, with optional midpoints for each range. This lets an intraday trader run daily levels alone, or stack all three groups to see how short-term and higher timeframe references line up.
🟠 CONCEPTS
* Previous Level - The high or low of the last completed daily, weekly or monthly candle, pulled from the higher timeframe regardless of the chart timeframe in use.
* Untaken Level - A level that price has not traded through since its period closed. Drawn at full opacity because the orders resting behind it are still there.
* Taken Level - A level that price has traded through during the current period. Recolored grey to show the liquidity has been collected and the level has lost its role as a target.
* Level Reset - Each group tracks its own taken state and resets when a new period begins. Daily flags clear every session while weekly and monthly flags run on their own cycles.
* Midpoint - The 50% level of a previous range, marking the equilibrium of that period rather than its extremes.
🟠 FEATURES
* Multi-Period Levels - Plots previous day, week and month highs and lows, each group toggleable on its own.
* Taken Level Fading - Automatically recolors any level that price trades through, leaving untouched levels highlighted.
* Optional Midpoints - Adds the 50% level of each enabled range for equilibrium reference.
* Level Labels - Tags each line with its name on the right edge of the chart, with configurable size.
* Level Alerts - Fires when price trades above a previous high or below a previous low.
🟠 HOW TO USE
* Run daily levels alone for intraday work, or enable weekly and monthly for a broader structural view.
* Treat bright levels as unfinished business and faded levels as history. What stays highlighted is where liquidity has not yet been taken.
* Watch for clusters where a daily level sits close to a weekly one. A single move that clears both tends to produce a sharper reaction than clearing either alone.
* Use midpoints as a filter. Price rotating around the midpoint of the previous day often points to balance rather than direction.
* Adjust Extend Right if the levels project too far past the current candle or stop short of it.
🟠 CONCLUSION
Previous Day, Week & Month Levels combines multi-period reference levels with automatic tracking of which levels have already been traded through. Instead of showing every level identically, it separates active liquidity from collected liquidity, giving traders a clear view of which reference points are still relevant to the current session.

Pine Script developer & trader. I build clean indicators - Smart Money Concepts, scanners, risk tools. ITAtradingtools.com
免責聲明
這些資訊和出版物並非旨在提供,也不構成TradingView提供或認可的任何形式的財務、投資、交易或其他類型的建議或推薦。請閱讀使用條款以了解更多資訊。
Pine Script developer & trader. I build clean indicators - Smart Money Concepts, scanners, risk tools. ITAtradingtools.com
免責聲明
這些資訊和出版物並非旨在提供,也不構成TradingView提供或認可的任何形式的財務、投資、交易或其他類型的建議或推薦。請閱讀使用條款以了解更多資訊。