OPEN-SOURCE SCRIPT
Auto Trend Lines [ZOM]
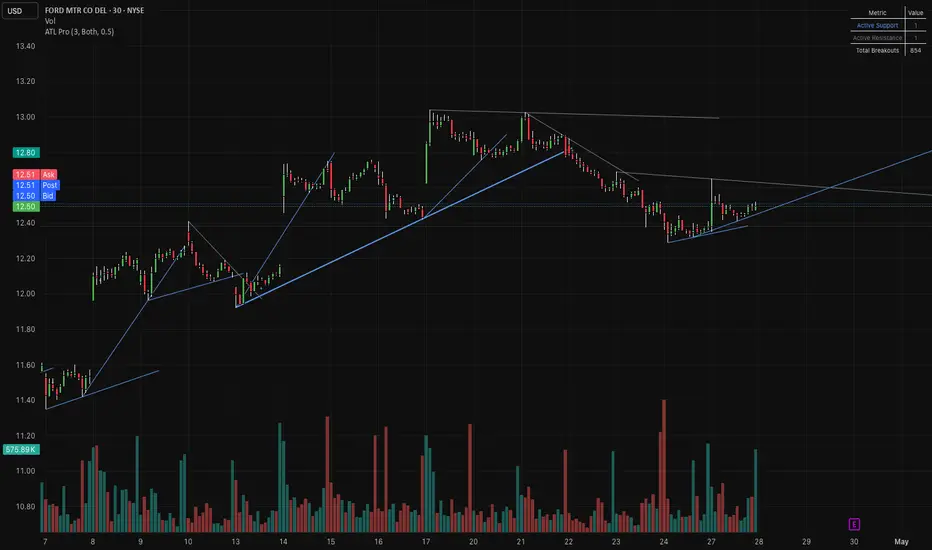
Auto Trend Lines [ZOM] (ATL Pro) is a dynamic trendline detection tool designed to automatically identify, draw, and manage support and resistance lines based on market structure.
The indicator uses pivot-based logic to detect both short-term and long-term swing points, allowing it to construct trend lines that adapt to evolving price action. By connecting relevant pivot highs and lows, it generates real-time support and resistance levels without requiring manual drawing.
To reduce noise and improve clarity, the script includes a proximity filtering system that prevents overlapping or redundant lines. This ensures that only meaningful structural levels are displayed, keeping charts clean while preserving key information.
Each trend line is continuously monitored for interaction with price. The indicator tracks touches, extensions, and breakout conditions, providing insight into how price respects or violates these levels over time. Breakouts are confirmed using a configurable number of consecutive closes beyond a line, helping filter out false breaks and improve signal quality.
Additional features include:
- Automatic detection of small and large pivot-based trend lines
- Real-time extension of active support and resistance levels
- Breakout confirmation logic based on candle closes
- Touch detection for tracking line validation
- Optional breakout markers for visual confirmation
- Alert system for new lines, touches, and confirmed breakouts
- Built-in statistics table showing active support/resistance and total breakouts
The indicator is designed to assist with identifying trend direction, key reaction zones, and potential breakout opportunities, all while minimizing manual chart work.
Its flexible settings allow traders to tailor sensitivity, structure size, and visual output to fit different strategies — from scalping to swing trading.
The indicator uses pivot-based logic to detect both short-term and long-term swing points, allowing it to construct trend lines that adapt to evolving price action. By connecting relevant pivot highs and lows, it generates real-time support and resistance levels without requiring manual drawing.
To reduce noise and improve clarity, the script includes a proximity filtering system that prevents overlapping or redundant lines. This ensures that only meaningful structural levels are displayed, keeping charts clean while preserving key information.
Each trend line is continuously monitored for interaction with price. The indicator tracks touches, extensions, and breakout conditions, providing insight into how price respects or violates these levels over time. Breakouts are confirmed using a configurable number of consecutive closes beyond a line, helping filter out false breaks and improve signal quality.
Additional features include:
- Automatic detection of small and large pivot-based trend lines
- Real-time extension of active support and resistance levels
- Breakout confirmation logic based on candle closes
- Touch detection for tracking line validation
- Optional breakout markers for visual confirmation
- Alert system for new lines, touches, and confirmed breakouts
- Built-in statistics table showing active support/resistance and total breakouts
The indicator is designed to assist with identifying trend direction, key reaction zones, and potential breakout opportunities, all while minimizing manual chart work.
Its flexible settings allow traders to tailor sensitivity, structure size, and visual output to fit different strategies — from scalping to swing trading.
開源腳本
秉持TradingView一貫精神,這個腳本的創作者將其設為開源,以便交易者檢視並驗證其功能。向作者致敬!您可以免費使用此腳本,但請注意,重新發佈代碼需遵守我們的社群規範。

免責聲明
這些資訊和出版物並非旨在提供,也不構成TradingView提供或認可的任何形式的財務、投資、交易或其他類型的建議或推薦。請閱讀使用條款以了解更多資訊。
免責聲明
這些資訊和出版物並非旨在提供,也不構成TradingView提供或認可的任何形式的財務、投資、交易或其他類型的建議或推薦。請閱讀使用條款以了解更多資訊。