PbD Impulse, Volume Profile & Setup Alerts
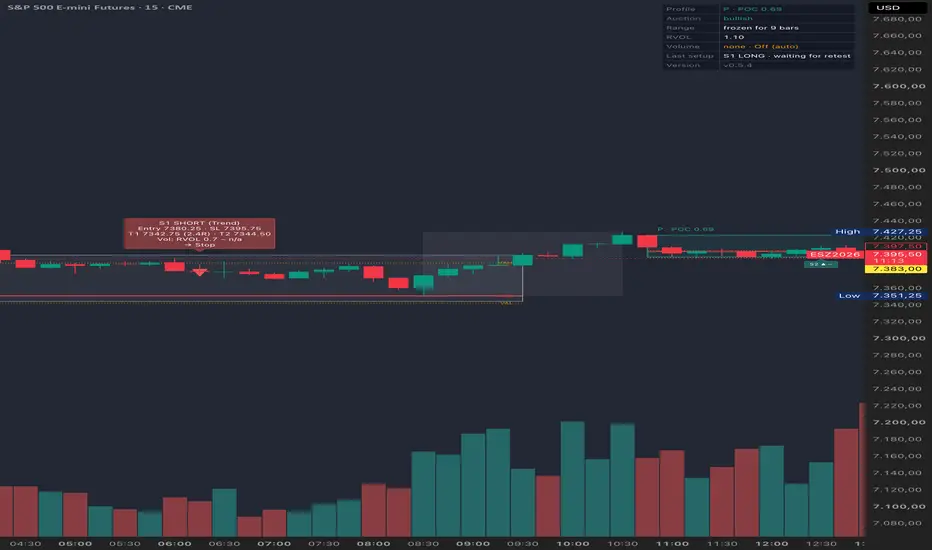
PbD reads the market the way an auction does: a strong directional move
(an impulse) is followed by a period of consolidation (a range). Once the
range has enough bars, the indicator builds a volume profile for it (POC,
VAH, VAL) and classifies it as:
P — bullish range after an up-impulse, volume sits high in the range
b — bearish range after a down-impulse, volume sits low in the range
D — balance, no clear directional bias
From there it watches for four recurring setups and marks them on the
chart with labels, boxes and, optionally, alerts:
S1 Break-in — re-entry into the value area after a brief excursion
S2 Breakout + Retest — continuation after a confirmed breakout
S3 Failed Breakout — counter-trend fade of a failed breakout
S4 Reversal — counter-trend reversal after a confirmed breakout
Each setup comes with entry, stop-loss and target levels, plus an optional
volume confirmation (RVOL) check.
This is a pure notification tool: no strategy(), no backtest equity curve,
no automated execution. It only draws levels and, optionally, fires
alerts — all trading decisions and order placement are up to you.
Quick start:
1. Add the indicator to a chart. Default settings are tuned for H1;
see the tooltips under Range & Profile for suggested tweaks on
faster intraday timeframes.
2. Adjust thresholds under Impulse / Range & Profile / Setups / Volume
to the instrument's volatility if needed.
3. To receive alerts, create one alert with condition "PbD" → "Any
alert() function call", interval "Once Per Bar Close", and leave the
message field empty — the text is generated by the script.
(an impulse) is followed by a period of consolidation (a range). Once the
range has enough bars, the indicator builds a volume profile for it (POC,
VAH, VAL) and classifies it as:
P — bullish range after an up-impulse, volume sits high in the range
b — bearish range after a down-impulse, volume sits low in the range
D — balance, no clear directional bias
From there it watches for four recurring setups and marks them on the
chart with labels, boxes and, optionally, alerts:
S1 Break-in — re-entry into the value area after a brief excursion
S2 Breakout + Retest — continuation after a confirmed breakout
S3 Failed Breakout — counter-trend fade of a failed breakout
S4 Reversal — counter-trend reversal after a confirmed breakout
Each setup comes with entry, stop-loss and target levels, plus an optional
volume confirmation (RVOL) check.
This is a pure notification tool: no strategy(), no backtest equity curve,
no automated execution. It only draws levels and, optionally, fires
alerts — all trading decisions and order placement are up to you.
Quick start:
1. Add the indicator to a chart. Default settings are tuned for H1;
see the tooltips under Range & Profile for suggested tweaks on
faster intraday timeframes.
2. Adjust thresholds under Impulse / Range & Profile / Setups / Volume
to the instrument's volatility if needed.
3. To receive alerts, create one alert with condition "PbD" → "Any
alert() function call", interval "Once Per Bar Close", and leave the
message field empty — the text is generated by the script.

免責聲明
這些資訊和出版物並非旨在提供,也不構成TradingView提供或認可的任何形式的財務、投資、交易或其他類型的建議或推薦。請閱讀使用條款以了解更多資訊。
免責聲明
這些資訊和出版物並非旨在提供,也不構成TradingView提供或認可的任何形式的財務、投資、交易或其他類型的建議或推薦。請閱讀使用條款以了解更多資訊。