STOC - Daily ADR - Buyer & Seller Zones
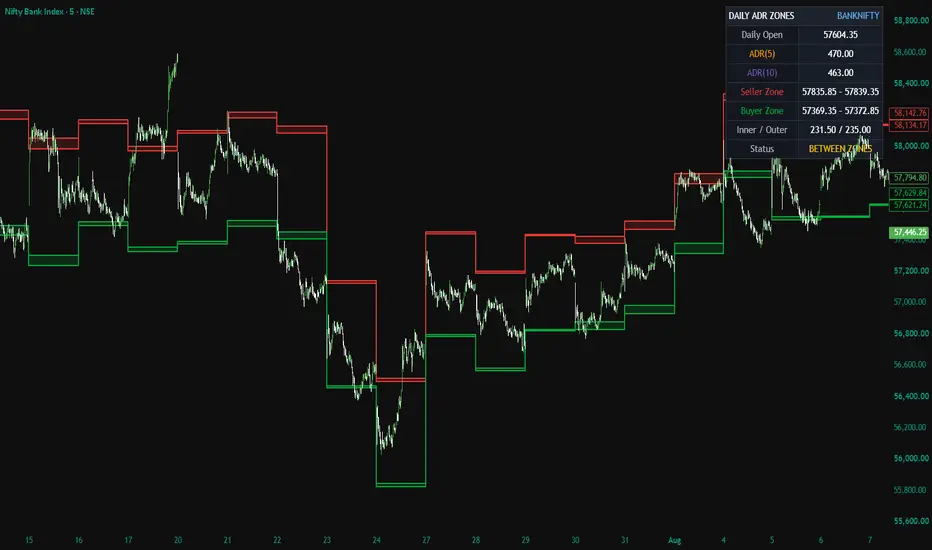
STOC – Daily ADR – Buyer & Seller Zones plots dynamic intraday reaction zones using the current daily open and the Average Daily Range of the previous 5 and 10 completed trading days.
The indicator projects volatility-adjusted distances above and below the daily open to create:
- Seller Zone: Potential resistance or profit-booking area
- Buyer Zone: Potential support or demand area
The zones remain fixed throughout the current session and do not repaint intraday.
Recommended timeframe: The indicator is best used on the **5-minute chart**, which provides a practical balance between timely entries and reliable zone reactions. The **1-minute chart** may be used only for refining entries after confirmation on the 5-minute chart, as it is more susceptible to market noise and false breakouts.
The indicator also includes an optional dashboard, daily-open and ADR boundary displays, historical zones, and alerts for zone touches and confirmed breakouts.
Use the zones alongside price action, market structure, trend direction, volume or other confirmation tools. They are not standalone buy or sell signals.
Disclaimer:
This indicator is provided for educational and informational purposes only. It does not constitute financial advice, investment recommendations, or trade signals.
The creator and Systematic Traders Club are not responsible for any financial losses resulting from the use of this indicator.
Trading and investing involve risk. Always do your own analysis and use proper risk management.
The indicator projects volatility-adjusted distances above and below the daily open to create:
- Seller Zone: Potential resistance or profit-booking area
- Buyer Zone: Potential support or demand area
The zones remain fixed throughout the current session and do not repaint intraday.
Recommended timeframe: The indicator is best used on the **5-minute chart**, which provides a practical balance between timely entries and reliable zone reactions. The **1-minute chart** may be used only for refining entries after confirmation on the 5-minute chart, as it is more susceptible to market noise and false breakouts.
The indicator also includes an optional dashboard, daily-open and ADR boundary displays, historical zones, and alerts for zone touches and confirmed breakouts.
Use the zones alongside price action, market structure, trend direction, volume or other confirmation tools. They are not standalone buy or sell signals.
Disclaimer:
This indicator is provided for educational and informational purposes only. It does not constitute financial advice, investment recommendations, or trade signals.
The creator and Systematic Traders Club are not responsible for any financial losses resulting from the use of this indicator.
Trading and investing involve risk. Always do your own analysis and use proper risk management.

Building STOC: Systematic and Rule Based Trading - Crypto, Commodities, India & Global Investments.
免責聲明
這些資訊和出版物並非旨在提供,也不構成TradingView提供或認可的任何形式的財務、投資、交易或其他類型的建議或推薦。請閱讀使用條款以了解更多資訊。
Building STOC: Systematic and Rule Based Trading - Crypto, Commodities, India & Global Investments.
免責聲明
這些資訊和出版物並非旨在提供,也不構成TradingView提供或認可的任何形式的財務、投資、交易或其他類型的建議或推薦。請閱讀使用條款以了解更多資訊。