已更新
Gianluca ATR Volatility Regime [CCE_Charts]
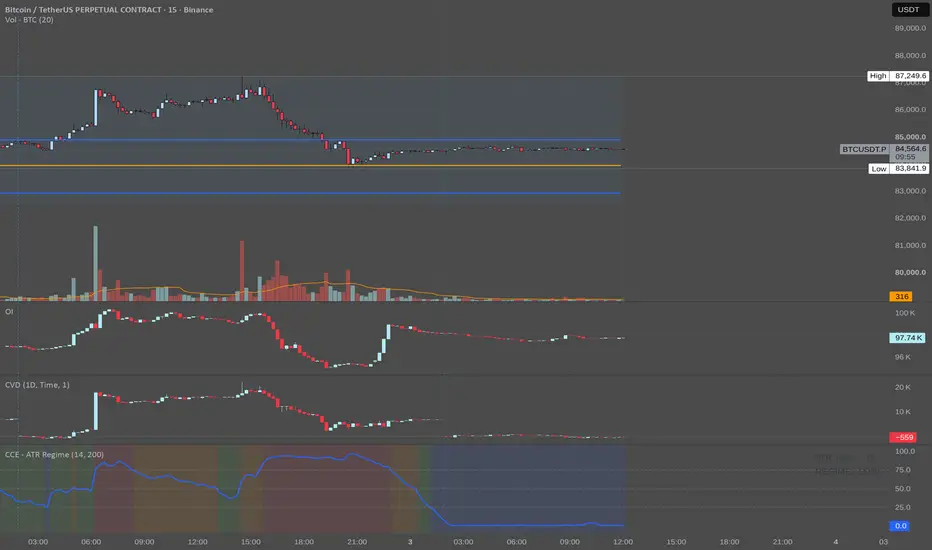
ATR Volatility Regime
This indicator classifies the current market volatility into four objective regimes using ATR Percentile.
The methodology uses the following calibration:
- ATR Length: 14
- Percentile Length: 200
The current ATR is compared against its historical values over the percentile lookback period. This converts the absolute ATR value into a relative volatility measure from 0 to 100.
Volatility Regimes
| ATR Percentile | Regime |
|---|---|
| 0–25 | LOW |
| 26–50 | MEDIUM |
| 51–75 | HIGH |
| 76–100 | EXTREME |
The purpose of the indicator is to make volatility regimes objective and comparable across different market conditions. Instead of asking whether a particular ATR value is "high" or "low", the indicator shows where the current volatility stands relative to its recent historical distribution.
The 14 / 200 calibration follows the methodology presented by Gianluca in his trading framework and is intended as a volatility-regime classification rather than a standalone trading signal.
Important: This indicator does not predict price direction or provide buy/sell signals. It identifies the current volatility environment, which can then be used to filter and evaluate a trading strategy.
This indicator classifies the current market volatility into four objective regimes using ATR Percentile.
The methodology uses the following calibration:
- ATR Length: 14
- Percentile Length: 200
The current ATR is compared against its historical values over the percentile lookback period. This converts the absolute ATR value into a relative volatility measure from 0 to 100.
Volatility Regimes
| ATR Percentile | Regime |
|---|---|
| 0–25 | LOW |
| 26–50 | MEDIUM |
| 51–75 | HIGH |
| 76–100 | EXTREME |
The purpose of the indicator is to make volatility regimes objective and comparable across different market conditions. Instead of asking whether a particular ATR value is "high" or "low", the indicator shows where the current volatility stands relative to its recent historical distribution.
The 14 / 200 calibration follows the methodology presented by Gianluca in his trading framework and is intended as a volatility-regime classification rather than a standalone trading signal.
Important: This indicator does not predict price direction or provide buy/sell signals. It identifies the current volatility environment, which can then be used to filter and evaluate a trading strategy.
發行說明
Added alert conditions.
免責聲明
這些資訊和出版物並非旨在提供,也不構成TradingView提供或認可的任何形式的財務、投資、交易或其他類型的建議或推薦。請閱讀使用條款以了解更多資訊。
免責聲明
這些資訊和出版物並非旨在提供,也不構成TradingView提供或認可的任何形式的財務、投資、交易或其他類型的建議或推薦。請閱讀使用條款以了解更多資訊。