OPEN-SOURCE SCRIPT
已更新 DVOL/(UVOL+DVOL) 5min INTRADAY
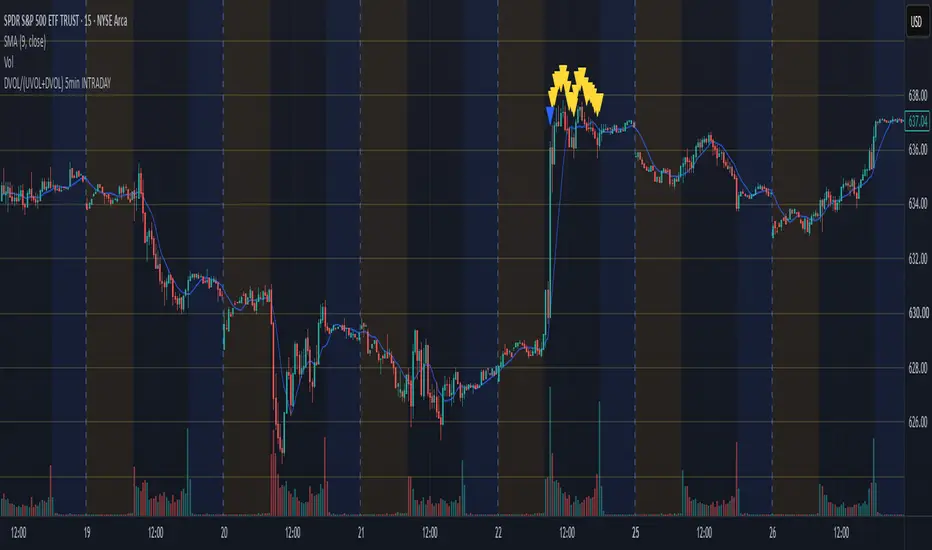
Overview:
This indicator tracks broad US market volume breadth in real-time to identify extreme intraday volume imbalances. By comparing Down Volume (USI:DVOL) against total volume (UVOL + DVOL) on a 5-minute timeframe, it pinpoints moments of aggressive market-wide buying and selling pressure that often signal intraday exhaustion points, reversals, or momentum continuation.
How It Works
The script calculates the ratio of declining volume against total market volume on every 5-minute candle:
Down Volume Ratio = DVOL / (UVOL+DVOL)
Extreme Down-Volume / Selling Pressure >= 89.9%
Triggers when down volume accounts for 89.9% or more of all traded volume across US markets. This often marks extreme panic selling or capitulation.
Extreme Up-Volume / Buying Pressure <= 9.9%
Triggers when down volume is under 10 (meaning Up Volume is 90%+).This marks broad-based market buying frenzies.
🟠 Orange Triangle (Below Bar) — Single High Threshold:
First occurrence of extreme market selling volume (≥89.9)
🟣 Purple Triangle (Below Bar) — Repeated High Threshold:
Extreme selling volume triggered when the condition has already appeared 2 or more times over the past 3 days (clustered selling pressure).
🔵 Blue Triangle (Above Bar) — Single Low Threshold:
First occurrence of extreme market buying volume (≤9.9%)
🟡 Yellow Triangle (Above Bar) — Repeated Low Threshold:
Extreme buying volume triggered when the condition has appeared 2 or more times over the past 3 days (clustered buying pressure).
Built-in Webhook & JSON Alerts
Whenever any single or repeated volume threshold is met, the indicator triggers a ready-to-use JSON alert payload (firing once per bar):
JSON:
{"text": "Trading Signal: Intraday SCALPING ONLY Short-Term trade SPY Triggered at [Price] Ticker [Ticker] Chart [Timeframe]"}
This is ideal for automated execution, Discord/Telegram webhooks, or alert routing.
This is designed specifically for SPY , SP500 indices , ES_F1! on a intraday timeframe and for intraday trading only.
This indicator tracks broad US market volume breadth in real-time to identify extreme intraday volume imbalances. By comparing Down Volume (USI:DVOL) against total volume (UVOL + DVOL) on a 5-minute timeframe, it pinpoints moments of aggressive market-wide buying and selling pressure that often signal intraday exhaustion points, reversals, or momentum continuation.
How It Works
The script calculates the ratio of declining volume against total market volume on every 5-minute candle:
Down Volume Ratio = DVOL / (UVOL+DVOL)
Extreme Down-Volume / Selling Pressure >= 89.9%
Triggers when down volume accounts for 89.9% or more of all traded volume across US markets. This often marks extreme panic selling or capitulation.
Extreme Up-Volume / Buying Pressure <= 9.9%
Triggers when down volume is under 10 (meaning Up Volume is 90%+).This marks broad-based market buying frenzies.
🟠 Orange Triangle (Below Bar) — Single High Threshold:
First occurrence of extreme market selling volume (≥89.9)
🟣 Purple Triangle (Below Bar) — Repeated High Threshold:
Extreme selling volume triggered when the condition has already appeared 2 or more times over the past 3 days (clustered selling pressure).
🔵 Blue Triangle (Above Bar) — Single Low Threshold:
First occurrence of extreme market buying volume (≤9.9%)
🟡 Yellow Triangle (Above Bar) — Repeated Low Threshold:
Extreme buying volume triggered when the condition has appeared 2 or more times over the past 3 days (clustered buying pressure).
Built-in Webhook & JSON Alerts
Whenever any single or repeated volume threshold is met, the indicator triggers a ready-to-use JSON alert payload (firing once per bar):
JSON:
{"text": "Trading Signal: Intraday SCALPING ONLY Short-Term trade SPY Triggered at [Price] Ticker [Ticker] Chart [Timeframe]"}
This is ideal for automated execution, Discord/Telegram webhooks, or alert routing.
This is designed specifically for
SPY , SP500 indices , ES_F1! on a intraday timeframe and for intraday trading only. 發行說明
Overview:This indicator tracks broad US market volume breadth in real-time to identify extreme intraday volume imbalances. By comparing Down Volume (USI:DVOL) against total volume (UVOL + DVOL) on a 5-minute timeframe, it pinpoints moments of aggressive market-wide buying and selling pressure that often signal intraday exhaustion points, reversals, or momentum continuation.
How It Works
The script calculates the ratio of declining volume against total market volume on every 5-minute candle:
Down Volume Ratio = DVOL / (UVOL+DVOL)
Extreme Down-Volume / Selling Pressure >= 89.9%
Triggers when down volume accounts for 89.9% or more of all traded volume across US markets. This often marks extreme panic selling or capitulation.
Extreme Up-Volume / Buying Pressure <= 9.9%
Triggers when down volume is under 10 (meaning Up Volume is 90%+).This marks broad-based market buying frenzies.
🟠 Orange Triangle (Below Bar) — Single High Threshold:
First occurrence of extreme market selling volume (≥89.9)
🟣 Purple Triangle (Below Bar) — Repeated High Threshold:
Extreme selling volume triggered when the condition has already appeared 2 or more times over the past 3 days (clustered selling pressure).
🔵 Blue Triangle (Above Bar) — Single Low Threshold:
First occurrence of extreme market buying volume (≤9.9%)
🟡 Yellow Triangle (Above Bar) — Repeated Low Threshold:
Extreme buying volume triggered when the condition has appeared 2 or more times over the past 3 days (clustered buying pressure).
Built-in Webhook & JSON Alerts
Whenever any single or repeated volume threshold is met, the indicator triggers a ready-to-use JSON alert payload (firing once per bar):
JSON:
{"text": "Trading Signal: Intraday SCALPING ONLY Short-Term trade SPY Triggered at [Price] Ticker [Ticker] Chart [Timeframe]"}
This is ideal for automated execution, Discord/Telegram webhooks, or alert routing.
This is designed specifically for
SPY
, SP500 indices , ES_F1! on a intraday timeframe and for intraday trading only.
發行說明
V3 Fixed a bug where the signal triggers prematurely at the day's opening print
開源腳本
秉持TradingView一貫精神,這個腳本的創作者將其設為開源,以便交易者檢視並驗證其功能。向作者致敬!您可以免費使用此腳本,但請注意,重新發佈代碼需遵守我們的社群規範。

免責聲明
這些資訊和出版物並非旨在提供,也不構成TradingView提供或認可的任何形式的財務、投資、交易或其他類型的建議或推薦。請閱讀使用條款以了解更多資訊。
開源腳本
秉持TradingView一貫精神,這個腳本的創作者將其設為開源,以便交易者檢視並驗證其功能。向作者致敬!您可以免費使用此腳本,但請注意,重新發佈代碼需遵守我們的社群規範。
免責聲明
這些資訊和出版物並非旨在提供,也不構成TradingView提供或認可的任何形式的財務、投資、交易或其他類型的建議或推薦。請閱讀使用條款以了解更多資訊。