OPEN-SOURCE SCRIPT
Institutional SMC Volume Profile Regression [Pro]
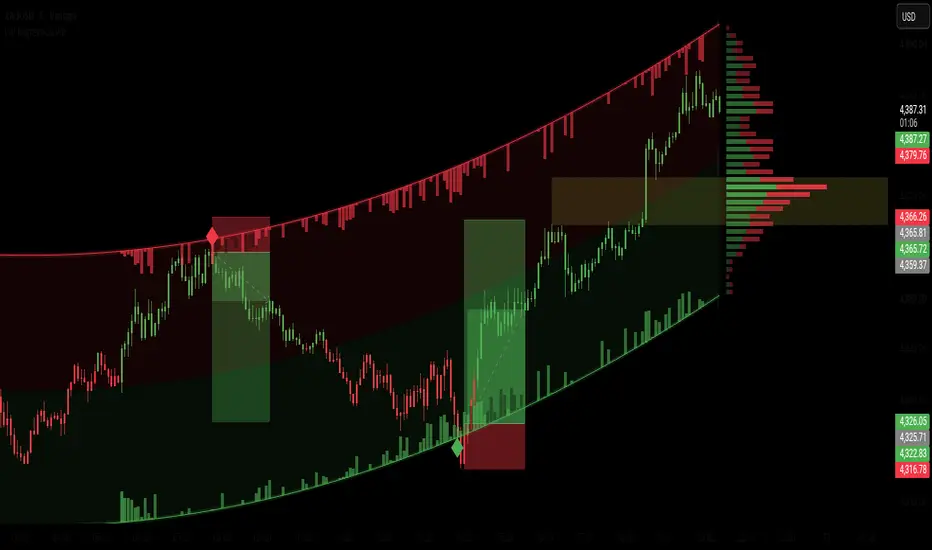
Institutional Volume Profile Regression [Pro]
Institutional Volume Profile Regression [Pro] combines polynomial curve fitting with structural volume distribution analysis to visualize dynamic order flow directly on the chart. It overlays inward volume pressure bars along standard deviation bounds and compiles an end-of-channel volume distribution profile.
Key Features
1. Polynomial Regression Channel Model
Computes a dynamic quadratic curve through matrix operations, creating an adaptive trend baseline that adjusts smoothly to medium-term volatility shifts without lagging.
2. Inward Dynamic Volume Pressure Bars
Renders directional buy and sell volume flow pointing inward from channel boundaries. Bullish accumulation builds from the lower band, while bearish distribution projects down from the upper band.
3. Boundary Volatility Contact Indicators
Marks first-contact touches at the outer standard deviation limits using directional diamond symbols to point out potential exhaustion zones.
4. Cumulative Volume Profile Distribution
Generates a horizontal volume distribution profile on the right side of the active regression window. High-volume nodes (HVNs) and low-volume nodes (LVNs) become visible along price levels.
5. Visual Trend Candles
Offers built-in background-aware candle painting that reflects the directional relationship relative to the regression baseline.
Settings Configuration
Regression Channel Settings
- Horizon & Deviation: Adjust regression lookback and standard deviation multiplier.
- Curve Model: Select between Linear and Polynomial fitting.
Inward Volume Settings
- Baseline & Height: Customize volume SMA lookback and ATR bar scaling.
- Flare Parameters: Adjust boundary zone percentage and volume multipliers.
Side Profile Settings
- Profile Bins: Adjust vertical price resolution rows.
- Horizontal Extent: Adjust maximum profile bar length.
Disclaimer
This tool is strictly designed for technical analysis and educational charting purposes. It does not constitute financial advice. Always employ risk management protocols.
Institutional Volume Profile Regression [Pro] combines polynomial curve fitting with structural volume distribution analysis to visualize dynamic order flow directly on the chart. It overlays inward volume pressure bars along standard deviation bounds and compiles an end-of-channel volume distribution profile.
Key Features
1. Polynomial Regression Channel Model
Computes a dynamic quadratic curve through matrix operations, creating an adaptive trend baseline that adjusts smoothly to medium-term volatility shifts without lagging.
2. Inward Dynamic Volume Pressure Bars
Renders directional buy and sell volume flow pointing inward from channel boundaries. Bullish accumulation builds from the lower band, while bearish distribution projects down from the upper band.
3. Boundary Volatility Contact Indicators
Marks first-contact touches at the outer standard deviation limits using directional diamond symbols to point out potential exhaustion zones.
4. Cumulative Volume Profile Distribution
Generates a horizontal volume distribution profile on the right side of the active regression window. High-volume nodes (HVNs) and low-volume nodes (LVNs) become visible along price levels.
5. Visual Trend Candles
Offers built-in background-aware candle painting that reflects the directional relationship relative to the regression baseline.
Settings Configuration
Regression Channel Settings
- Horizon & Deviation: Adjust regression lookback and standard deviation multiplier.
- Curve Model: Select between Linear and Polynomial fitting.
Inward Volume Settings
- Baseline & Height: Customize volume SMA lookback and ATR bar scaling.
- Flare Parameters: Adjust boundary zone percentage and volume multipliers.
Side Profile Settings
- Profile Bins: Adjust vertical price resolution rows.
- Horizontal Extent: Adjust maximum profile bar length.
Disclaimer
This tool is strictly designed for technical analysis and educational charting purposes. It does not constitute financial advice. Always employ risk management protocols.
開源腳本
秉持TradingView一貫精神,這個腳本的創作者將其設為開源,以便交易者檢視並驗證其功能。向作者致敬!您可以免費使用此腳本,但請注意,重新發佈代碼需遵守我們的社群規範。

免責聲明
這些資訊和出版物並非旨在提供,也不構成TradingView提供或認可的任何形式的財務、投資、交易或其他類型的建議或推薦。請閱讀使用條款以了解更多資訊。
開源腳本
秉持TradingView一貫精神,這個腳本的創作者將其設為開源,以便交易者檢視並驗證其功能。向作者致敬!您可以免費使用此腳本,但請注意,重新發佈代碼需遵守我們的社群規範。
免責聲明
這些資訊和出版物並非旨在提供,也不構成TradingView提供或認可的任何形式的財務、投資、交易或其他類型的建議或推薦。請閱讀使用條款以了解更多資訊。