MMM Market Structure & Order Flow @MaxMaserati 3.0
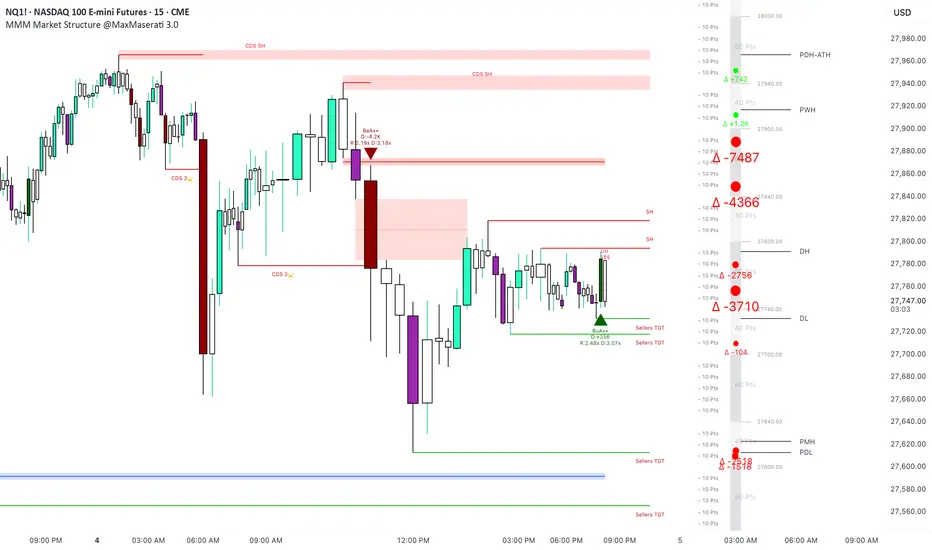
MMM Market Structure & Order Flow Suite
The MMM Market Structure & Order Flow Suite is the flagship technical analysis system of the Max Maserati Model (MMM) — a trading philosophy built on the principle that every price movement is the direct result of a battle between passive liquidity and aggressive order flow. Rather than relying on lagging indicators or subjective pattern recognition, the MMM methodology reads the market as a continuous auction, where price is always seeking to find the most efficient level at which both buyers and sellers are willing to transact.
This suite translates that philosophy into a fully mechanical, rule-based charting system. It maps market structure, order flow dynamics, volume imbalances, and liquidity voids across every confirmed candle close — giving traders a clear, objective picture of who is in control of the auction at any given moment and where the market is most likely to move next.
1. NBC & BC Candles (The Auction State)
The foundation of the Max Maserati Model begins with reading the state of the auction through candle closures. Every candle tells a story about whether the market is in balance or whether one side has seized control.
NBC (No Body Close / Fair Pricing): A balanced, two-way auction where buyers and sellers are transacting efficiently and neither side has overwhelmed the other. Both participants are present, liquidity is flowing freely, and the market is printing fair value. These candles represent equilibrium and are displayed in standard neutral colours.
BC (Body Close / Unfair Pricing): Aggressive market orders have overwhelmed passive limit orders, pushing price significantly beyond the prior candle's range and locking out one side of the market entirely. Because one side cannot participate during this aggressive push, the price reached is considered institutionally unfair — and in auction theory, unfair pricing is always a candidate for correction. These candles are highlighted in custom MMM colours to immediately separate aggressive expansion from balanced rotation.

2. Accelerator Candles (AX)
Accelerator candles are a specific sub-class of BC candles that the MMM methodology treats as high-conviction momentum signals. They are not simply large candles — they must be backed by both exceptional range expansion and a significant delta reading relative to recent historical averages.
The logic is rooted in energy expenditure: when the market burns through an extraordinary amount of liquidity to generate a single move, it tends to exhaust the aggressive side temporarily. Price will often pause at these levels, pull back to partially rebalance the expanded range, or establish a significant structural turning point. The suite flags these candles with AX labels and displays the exact range and delta expansion ratios versus recent averages, so traders can immediately assess the intensity of the move and anticipate what is likely to follow.

3. Structural Breaks (CDL / CDS)
In the Max Maserati Model, not all breaks of structure are created equal. The MMM framework applies a strict body-close rule that filters out the noise of wick-based violations — because in auction theory, a wick simply represents a rejected price exploration, not a committed directional move.
A structural break is only confirmed when a candle's body fully closes beyond a validated Swing High or Swing Low. CDL (Change of Delivery Long) marks a confirmed bullish structural break where aggressive buyers have successfully closed price above a prior swing high. CDS (Change of Delivery Short) marks a confirmed bearish structural break where aggressive sellers have closed price below a prior swing low. Each swing need to have at least a BC candle to be considered as valid. Every break is graded 1 to 3 stars based on the volume behind the breakout candle, giving traders an immediate read on the institutional conviction behind the move.

4. UH / UL (Unbalanced High / Unbalanced Low)
One of the more precise concepts within the MMM methodology is the identification of un-auctioned price levels — specific extremes where the market moved so aggressively in one direction that it never allowed two-way participation at that exact price.
When a candle closes perfectly flat at its extreme — no upper wick on a bearish candle, or no lower wick on a bullish candle — it means the matching engine never had the opportunity to auction price at that level from the opposing side. The suite identifies these as UH (Unbalanced High) and UL (Unbalanced Low), marking them with a $$$ sign and UH/UL text. In auction theory, unfinished business always gets revisited — price carries a high mathematical tendency to return and sweep these specific levels to complete the auction process. Markers delete automatically the moment price touches them, keeping the chart clean and objective.

5. Structural Voids (Gaps)
Where standard analysis refers to these as Fair Value Gaps, the Max Maserati Model explicitly rejects that framing. A gap does not represent fair value — it represents a bypassed auction, a zone where pricing was so aggressive that one side of the market was completely excluded. The suite identifies three distinct types of structural voids and removes them automatically once price returns to fill them:
UDG (Unfair Distribution Gap): The classic 3-candle gap where a middle candle prints a massive range with no overlap between the high of the first candle and the low of the third. Pure, one-sided distribution with no two-way participation across the entire zone.
UOG (Unfair Opening Gap): A true price vacuum where a candle's open is completely detached from the prior candle's close. Typically triggered by news events or major session transitions, these represent total liquidity vacuums that forced the matching engine to skip entire price levels entirely.
ULG (Unfair Liquidity Gap): The most subtle of the three — overlapping wicks suggest some price exploration occurred, but the bodies of adjacent candles are completely detached, revealing that the actual transactional zone between the two candles was paper-thin. Extremely low liquidity in this area makes it a high-probability return target.
6. Volume Bubbles & Delta
Order flow is the engine behind every structural move in the MMM framework, and this module makes that order flow visible at the price level. Using tick-level footprint data where available — or a sophisticated synthetic OHLCV delta calculation as a fallback — the suite measures exact Delta (Buy Volume minus Sell Volume) on every candle and across specific price zones.
Visual Volume Bubbles are projected onto the chart to show net delta positioning inside defined grid ranges, revealing precisely where aggressive buyers or sellers are most concentrated. This allows traders to confirm whether a structural break or gap fill is backed by genuine institutional order flow, or whether it is an unsupported move vulnerable to reversal.

7. Imbalances
Beyond the standard gap structures, the MMM suite performs a deeper scan for intra-candle imbalances — zones where volume has clustered so heavily on one side of a candle that proper two-way price rotation never occurred within that candle's range itself.
When open or close boundaries show extreme one-sided volume without any meaningful rotation back through those levels, the suite registers an active imbalance node. These nodes function as localised, high-sensitivity support and resistance areas that remain active until price naturally rotates back through them to rebalance the order book. They are often the most precise entry and reaction levels on the chart precisely because they represent the market's unfinished internal business.
8. Trade Measurements & Grid Geometry
The final layer of the suite is a dynamic Ruler Geometry system that removes the need for manual measurement tools entirely. Customisable point-based grid zones — defaulting to 40-point and 60-point intervals aligned to the MMM risk framework — are automatically projected forward from the current price level.
This gives traders an instant visual framework to quantify risk parameters, measure objective profit targets, track tick and point progression in real time, and maintain consistent position sizing discipline — all without cluttering the chart with manual drawings. The grid adapts dynamically as price moves, ensuring the projection always reflects the current market context.
Note: This script does not repaint. All lines, gap boxes, wickless markers, and structural labels are calculated exclusively on confirmed candle closes and delete in real-time the moment they are mitigated by live price action. Every signal you see on this chart has already been confirmed by the market.
The MMM Market Structure & Order Flow Suite is the flagship technical analysis system of the Max Maserati Model (MMM) — a trading philosophy built on the principle that every price movement is the direct result of a battle between passive liquidity and aggressive order flow. Rather than relying on lagging indicators or subjective pattern recognition, the MMM methodology reads the market as a continuous auction, where price is always seeking to find the most efficient level at which both buyers and sellers are willing to transact.
This suite translates that philosophy into a fully mechanical, rule-based charting system. It maps market structure, order flow dynamics, volume imbalances, and liquidity voids across every confirmed candle close — giving traders a clear, objective picture of who is in control of the auction at any given moment and where the market is most likely to move next.
1. NBC & BC Candles (The Auction State)
The foundation of the Max Maserati Model begins with reading the state of the auction through candle closures. Every candle tells a story about whether the market is in balance or whether one side has seized control.
NBC (No Body Close / Fair Pricing): A balanced, two-way auction where buyers and sellers are transacting efficiently and neither side has overwhelmed the other. Both participants are present, liquidity is flowing freely, and the market is printing fair value. These candles represent equilibrium and are displayed in standard neutral colours.
BC (Body Close / Unfair Pricing): Aggressive market orders have overwhelmed passive limit orders, pushing price significantly beyond the prior candle's range and locking out one side of the market entirely. Because one side cannot participate during this aggressive push, the price reached is considered institutionally unfair — and in auction theory, unfair pricing is always a candidate for correction. These candles are highlighted in custom MMM colours to immediately separate aggressive expansion from balanced rotation.
2. Accelerator Candles (AX)
Accelerator candles are a specific sub-class of BC candles that the MMM methodology treats as high-conviction momentum signals. They are not simply large candles — they must be backed by both exceptional range expansion and a significant delta reading relative to recent historical averages.
The logic is rooted in energy expenditure: when the market burns through an extraordinary amount of liquidity to generate a single move, it tends to exhaust the aggressive side temporarily. Price will often pause at these levels, pull back to partially rebalance the expanded range, or establish a significant structural turning point. The suite flags these candles with AX labels and displays the exact range and delta expansion ratios versus recent averages, so traders can immediately assess the intensity of the move and anticipate what is likely to follow.
3. Structural Breaks (CDL / CDS)
In the Max Maserati Model, not all breaks of structure are created equal. The MMM framework applies a strict body-close rule that filters out the noise of wick-based violations — because in auction theory, a wick simply represents a rejected price exploration, not a committed directional move.
A structural break is only confirmed when a candle's body fully closes beyond a validated Swing High or Swing Low. CDL (Change of Delivery Long) marks a confirmed bullish structural break where aggressive buyers have successfully closed price above a prior swing high. CDS (Change of Delivery Short) marks a confirmed bearish structural break where aggressive sellers have closed price below a prior swing low. Each swing need to have at least a BC candle to be considered as valid. Every break is graded 1 to 3 stars based on the volume behind the breakout candle, giving traders an immediate read on the institutional conviction behind the move.
4. UH / UL (Unbalanced High / Unbalanced Low)
One of the more precise concepts within the MMM methodology is the identification of un-auctioned price levels — specific extremes where the market moved so aggressively in one direction that it never allowed two-way participation at that exact price.
When a candle closes perfectly flat at its extreme — no upper wick on a bearish candle, or no lower wick on a bullish candle — it means the matching engine never had the opportunity to auction price at that level from the opposing side. The suite identifies these as UH (Unbalanced High) and UL (Unbalanced Low), marking them with a $$$ sign and UH/UL text. In auction theory, unfinished business always gets revisited — price carries a high mathematical tendency to return and sweep these specific levels to complete the auction process. Markers delete automatically the moment price touches them, keeping the chart clean and objective.
5. Structural Voids (Gaps)
Where standard analysis refers to these as Fair Value Gaps, the Max Maserati Model explicitly rejects that framing. A gap does not represent fair value — it represents a bypassed auction, a zone where pricing was so aggressive that one side of the market was completely excluded. The suite identifies three distinct types of structural voids and removes them automatically once price returns to fill them:
UDG (Unfair Distribution Gap): The classic 3-candle gap where a middle candle prints a massive range with no overlap between the high of the first candle and the low of the third. Pure, one-sided distribution with no two-way participation across the entire zone.
UOG (Unfair Opening Gap): A true price vacuum where a candle's open is completely detached from the prior candle's close. Typically triggered by news events or major session transitions, these represent total liquidity vacuums that forced the matching engine to skip entire price levels entirely.
ULG (Unfair Liquidity Gap): The most subtle of the three — overlapping wicks suggest some price exploration occurred, but the bodies of adjacent candles are completely detached, revealing that the actual transactional zone between the two candles was paper-thin. Extremely low liquidity in this area makes it a high-probability return target.
6. Volume Bubbles & Delta
Order flow is the engine behind every structural move in the MMM framework, and this module makes that order flow visible at the price level. Using tick-level footprint data where available — or a sophisticated synthetic OHLCV delta calculation as a fallback — the suite measures exact Delta (Buy Volume minus Sell Volume) on every candle and across specific price zones.
Visual Volume Bubbles are projected onto the chart to show net delta positioning inside defined grid ranges, revealing precisely where aggressive buyers or sellers are most concentrated. This allows traders to confirm whether a structural break or gap fill is backed by genuine institutional order flow, or whether it is an unsupported move vulnerable to reversal.
7. Imbalances
Beyond the standard gap structures, the MMM suite performs a deeper scan for intra-candle imbalances — zones where volume has clustered so heavily on one side of a candle that proper two-way price rotation never occurred within that candle's range itself.
When open or close boundaries show extreme one-sided volume without any meaningful rotation back through those levels, the suite registers an active imbalance node. These nodes function as localised, high-sensitivity support and resistance areas that remain active until price naturally rotates back through them to rebalance the order book. They are often the most precise entry and reaction levels on the chart precisely because they represent the market's unfinished internal business.
8. Trade Measurements & Grid Geometry
The final layer of the suite is a dynamic Ruler Geometry system that removes the need for manual measurement tools entirely. Customisable point-based grid zones — defaulting to 40-point and 60-point intervals aligned to the MMM risk framework — are automatically projected forward from the current price level.
This gives traders an instant visual framework to quantify risk parameters, measure objective profit targets, track tick and point progression in real time, and maintain consistent position sizing discipline — all without cluttering the chart with manual drawings. The grid adapts dynamically as price moves, ensuring the projection always reflects the current market context.
Note: This script does not repaint. All lines, gap boxes, wickless markers, and structural labels are calculated exclusively on confirmed candle closes and delete in real-time the moment they are mitigated by live price action. Every signal you see on this chart has already been confirmed by the market.

MMM : No body close (PO4), No Trade.
maxmaserati.com/
maxmaserati.com/
免責聲明
這些資訊和出版物並非旨在提供,也不構成TradingView提供或認可的任何形式的財務、投資、交易或其他類型的建議或推薦。請閱讀使用條款以了解更多資訊。
MMM : No body close (PO4), No Trade.
maxmaserati.com/
maxmaserati.com/
免責聲明
這些資訊和出版物並非旨在提供,也不構成TradingView提供或認可的任何形式的財務、投資、交易或其他類型的建議或推薦。請閱讀使用條款以了解更多資訊。