OPEN-SOURCE SCRIPT
Tension Flow RR [JOAT]
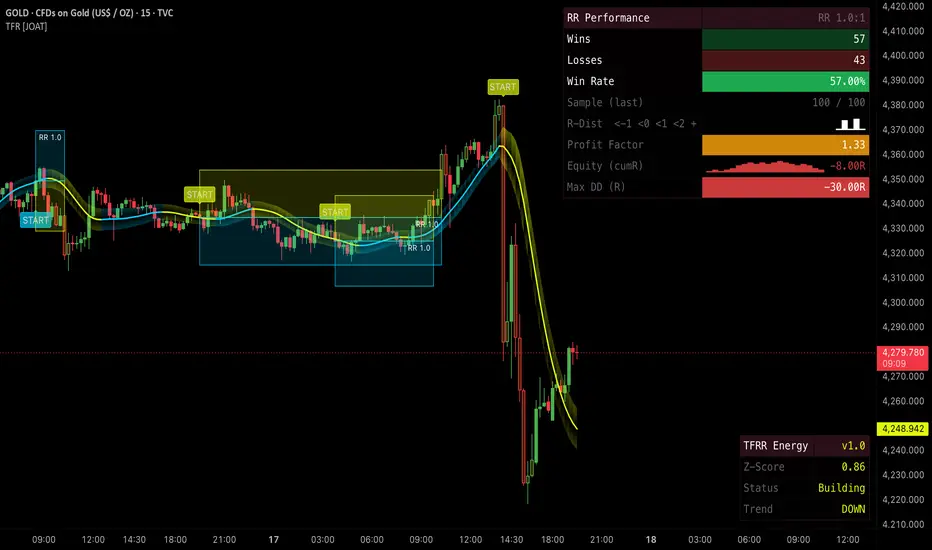
TENSION FLOW RR [JOAT]
A trend-signal engine wrapped in a full risk-reward execution layer — Hull Moving Average baseline, Z-score normalised tension reading, ATR-sized stops and targets, optional R-multiple-triggered trailing stop, and a rolling-window backtest that tracks every closed trade and reports win rate / cumulative R / equity sparkline directly on the chart. Built for traders who care about what happens after the signal fires, not just the signal itself.
Trend signal — HMA + Z-score tension
Two cleanly chosen primitives:
A new trend signal fires when the configured signal cooldown has elapsed and the directional logic flips. The signal is non-repainting (confirmed on bar close).

ATR-sized stops and targets
Each signal automatically renders:
This is full execution geometry — you can see entry, stop, target, and the trail's path on the chart at all times.
Rolling-window backtest (the headline)
The script tracks the last N closed trades (configurable, default 100) and produces live performance statistics that update tick-by-tick:
Trades are evicted FIFO when the history window is exceeded, so the win rate is always a rolling read of recent performance, not lifetime stats — which is the right read for a working trader.
Two dashboards
Both are independently positionable, sizeable, and toggle-able. The split lets you run "engine state" on one corner and "PnL state" on the other without overlap.
Trend ribbon
The HMA is rendered with an ATR-band ribbon (configurable width) whose transparency is dynamically modulated by current Z-score — the ribbon visually breathes with tension. Toggle off if you prefer a clean line.
Alerts
Alert conditions are exposed for new signals, SL hits, TP hits, trailing-stop hits, overextension events, and two win-rate threshold alerts: Win-Rate High (crossover above the configured high level) and Win-Rate Low (crossunder below the configured low level). Win-rate alerts are suppressed until a minimum sample size has been recorded, so you do not get a 100% win-rate alert from a single lucky trade.
How to read it
The script is designed to be used as a closed loop:
The cumulative-R sparkline is the most honest single line on the dashboard — if it is climbing, the engine is doing its job; if it is grinding flat or down, it isn't, and you should re-evaluate parameters or stand aside.
Suggested settings
Defaults (HMA 50, Z 50, 2.0 R-stop, 1.0 R-target) are calibrated for 1H–4H on liquid markets. For lower timeframes drop both lengths proportionally and consider a Risk:Reward above 1.0 to offset the higher signal frequency. For daily and above, raise lengths and lower the signal cooldown.
Originality / what's reused
HMA, Z-score, and ATR-sized stops are public-domain primitives, used here as building blocks. The implementation — the Z-normalised tension reading, the R-multiple activation trailing stop with break-even lock, the colour-coded rolling-N backtest, the Unicode equity sparkline rendered inside table cells, the dual-dashboard split, and the sample-gated win-rate alerts — is JOAT-original and tuned together. No third-party code reused.
Open source
Published open-source under the default Mozilla Public License 2.0. The execution geometry, the rolling-trade tracker, the Z-modulated ribbon, and the sparkline renderer are each isolated so you can adapt any one without reading the whole file. Forks welcome with credit.
Limitations
The rolling backtest is a descriptive read of recent signal performance under the current settings — it is not a predictive metric and changing the parameters resets the read. SL / TP geometry assumes a single position per signal direction; the script is not a position manager. Trailing stop fires on confirmed bars; intra-bar movement past the trail level is registered but the close determines the outcome.
—
-made with passion by jackofalltrades
A trend-signal engine wrapped in a full risk-reward execution layer — Hull Moving Average baseline, Z-score normalised tension reading, ATR-sized stops and targets, optional R-multiple-triggered trailing stop, and a rolling-window backtest that tracks every closed trade and reports win rate / cumulative R / equity sparkline directly on the chart. Built for traders who care about what happens after the signal fires, not just the signal itself.
Trend signal — HMA + Z-score tension
Two cleanly chosen primitives:
- Hull Moving Average (HMA) — a chained-WMA construct that delivers a fast, low-lag trend baseline. The square-root final smoothing step is what makes it noticeably less laggy than EMA at the same length.
- Z-score of (close − HMA) — the residual is normalised by its own rolling stdev so the tension reading is dimensionless and comparable across instruments. |Z| above the overextended threshold (default 2.0) tags the move as overextended in the Energy Dashboard.
A new trend signal fires when the configured signal cooldown has elapsed and the directional logic flips. The signal is non-repainting (confirmed on bar close).
ATR-sized stops and targets
Each signal automatically renders:
- SL box — a translucent box sized at SL-ATR × multiplier (default 2.0 × ATR-200) from entry, drawn in the bear colour.
- TP box — sized at SL distance × Risk:Reward ratio (default 1.0R), drawn in the bull colour.
- Trailing-stop line (optional, JOAT enhancement) — when enabled and price moves more than the activation threshold (in R-multiples) in your favour, the stop ratchets behind price by Trail-ATR × multiplier. Configurable bar-by-bar trail step, optional break-even lock at activation.
This is full execution geometry — you can see entry, stop, target, and the trail's path on the chart at all times.
Rolling-window backtest (the headline)
The script tracks the last N closed trades (configurable, default 100) and produces live performance statistics that update tick-by-tick:
- Total trades, wins, losses, breakevens.
- Win rate, with colour-coded cell — green above the configured "green" threshold, amber between, red below.
- Average R per trade, best R, worst R.
- Cumulative R since the start of the window.
- Profit factor.
- Expectancy in R-multiples.
- Unicode equity sparkline — a compact in-cell chart of the last N cumulative-R points, drawn directly in the dashboard cells with block-character glyphs.
Trades are evicted FIFO when the history window is exceeded, so the win rate is always a rolling read of recent performance, not lifetime stats — which is the right read for a working trader.
Two dashboards
- Energy Dashboard (Bottom-Right by default) — compact 22-row read of current Z-score, trend direction, HMA value, overextension flag, ribbon width, ATR, and signal state.
- RR Performance Dashboard (Top-Right by default) — 29-row institutional read of the rolling backtest stats above, plus the equity sparkline.
Both are independently positionable, sizeable, and toggle-able. The split lets you run "engine state" on one corner and "PnL state" on the other without overlap.
Trend ribbon
The HMA is rendered with an ATR-band ribbon (configurable width) whose transparency is dynamically modulated by current Z-score — the ribbon visually breathes with tension. Toggle off if you prefer a clean line.
Alerts
Alert conditions are exposed for new signals, SL hits, TP hits, trailing-stop hits, overextension events, and two win-rate threshold alerts: Win-Rate High (crossover above the configured high level) and Win-Rate Low (crossunder below the configured low level). Win-rate alerts are suppressed until a minimum sample size has been recorded, so you do not get a 100% win-rate alert from a single lucky trade.
How to read it
The script is designed to be used as a closed loop:
- Take the trend-start signal as the entry. The HMA + Z-score logic is the signal; the SL/TP boxes are the geometry.
- If trailing is enabled, the line will appear once unrealised PnL exceeds the activation threshold and will ratchet from there.
- When the trade closes, the rolling backtest updates — watch the win-rate colour and the cumulative-R sparkline.
- If win-rate trips the low alert, that is the script telling you the current regime does not suit the current settings.
The cumulative-R sparkline is the most honest single line on the dashboard — if it is climbing, the engine is doing its job; if it is grinding flat or down, it isn't, and you should re-evaluate parameters or stand aside.
Suggested settings
Defaults (HMA 50, Z 50, 2.0 R-stop, 1.0 R-target) are calibrated for 1H–4H on liquid markets. For lower timeframes drop both lengths proportionally and consider a Risk:Reward above 1.0 to offset the higher signal frequency. For daily and above, raise lengths and lower the signal cooldown.
Originality / what's reused
HMA, Z-score, and ATR-sized stops are public-domain primitives, used here as building blocks. The implementation — the Z-normalised tension reading, the R-multiple activation trailing stop with break-even lock, the colour-coded rolling-N backtest, the Unicode equity sparkline rendered inside table cells, the dual-dashboard split, and the sample-gated win-rate alerts — is JOAT-original and tuned together. No third-party code reused.
Open source
Published open-source under the default Mozilla Public License 2.0. The execution geometry, the rolling-trade tracker, the Z-modulated ribbon, and the sparkline renderer are each isolated so you can adapt any one without reading the whole file. Forks welcome with credit.
Limitations
The rolling backtest is a descriptive read of recent signal performance under the current settings — it is not a predictive metric and changing the parameters resets the read. SL / TP geometry assumes a single position per signal direction; the script is not a position manager. Trailing stop fires on confirmed bars; intra-bar movement past the trail level is registered but the close determines the outcome.
—
-made with passion by jackofalltrades
開源腳本
秉持TradingView一貫精神,這個腳本的創作者將其設為開源,以便交易者檢視並驗證其功能。向作者致敬!您可以免費使用此腳本,但請注意,重新發佈代碼需遵守我們的社群規範。

The Institutional Grade Trading Ecosystem, Built to win trades 📈
Get Access 👇
jackofalltrades.vip 🌐
t.me/jackofalltradesvip 🃏
Get Access 👇
jackofalltrades.vip 🌐
t.me/jackofalltradesvip 🃏
免責聲明
這些資訊和出版物並非旨在提供,也不構成TradingView提供或認可的任何形式的財務、投資、交易或其他類型的建議或推薦。請閱讀使用條款以了解更多資訊。
開源腳本
秉持TradingView一貫精神,這個腳本的創作者將其設為開源,以便交易者檢視並驗證其功能。向作者致敬!您可以免費使用此腳本,但請注意,重新發佈代碼需遵守我們的社群規範。
The Institutional Grade Trading Ecosystem, Built to win trades 📈
Get Access 👇
jackofalltrades.vip 🌐
t.me/jackofalltradesvip 🃏
Get Access 👇
jackofalltrades.vip 🌐
t.me/jackofalltradesvip 🃏
免責聲明
這些資訊和出版物並非旨在提供,也不構成TradingView提供或認可的任何形式的財務、投資、交易或其他類型的建議或推薦。請閱讀使用條款以了解更多資訊。