OPEN-SOURCE SCRIPT
Alpha Signal Engine [MarkitTick]
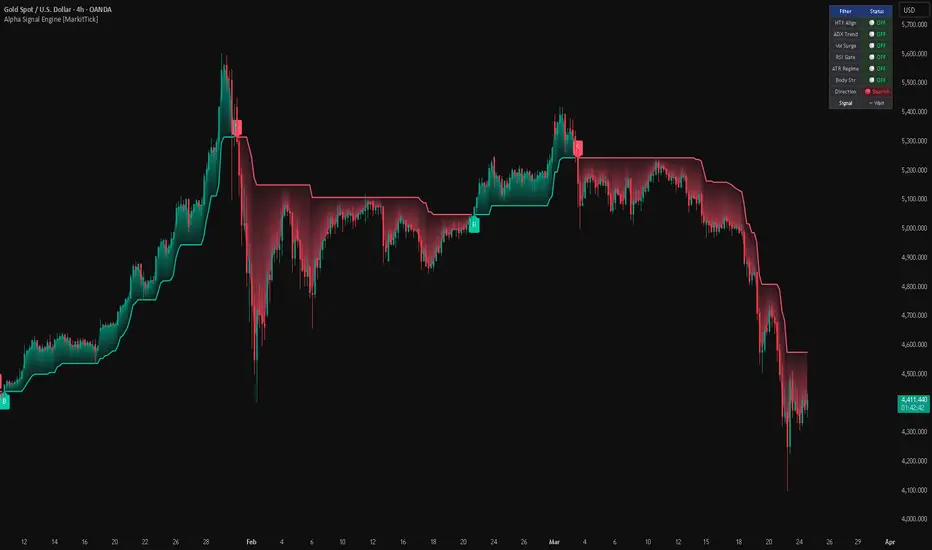
💡 The Alpha Signal Engine is an advanced, multi-dimensional trend-following system designed to provide traders with highly filtered, high-probability market signals. At its core, it dynamically calculates a volatility-adjusted trailing band to determine the primary market direction. However, unlike traditional trend indicators that rely on a single data point, this engine passes every potential trend reversal through a rigorous, six-layer filtering mechanism. By requiring confluence across higher timeframe trends, momentum, volume, volatility regimes, and price action strength, it drastically reduces the noise and false signals inherent in choppy markets. It also features a built-in heads-up dashboard and fully formatted JSON webhook capabilities for automated trading integration.
✨ Originality and Utility
● A Dynamic, Adaptive Baseline
Standard trailing stop or trend indicators, such as the classic Supertrend, typically use a static multiplier against the Average True Range (ATR). The Alpha Signal Engine innovates by introducing a "Dynamic Factor." This factor continuously adapts the band's distance from price by factoring in the current baseline multiplier, the relative volatility (ATR normalized by price), and the immediate price change momentum. This allows the bands to tighten during periods of strong, directional momentum and widen during erratic volatility, providing a more responsive and intelligent trailing mechanism.
● The Six-Pillar Filtering Gateway
The true utility of this indicator lies in its modular filtering engine. Traders often have to clutter their charts with half a dozen indicators to confirm a setup. This script centralizes that logic. Users can selectively enable or disable filters based on their specific asset and trading style, turning the indicator into a customizable algorithmic engine. Whether you need volume confirmation, ADX trend strength, or simple RSI momentum, the script handles the complex boolean logic internally and only outputs a signal when your precise market conditions are met.
🔬 Methodology and Concepts
● Dynamic Factor Calculation
The indicator establishes its baseline trend using an upper and lower band. The distance of these bands from the median price is dictated by a dynamically calculated factor. This factor is the sum of a base value, a volatility component (ATR divided by Close, scaled by a user weight), and a price movement component (percentage change of the close, scaled by a user weight). This raw factor is then smoothed using a Simple Moving Average (SMA) to prevent erratic band shifts.
● Trend Determination
The trend direction flips when the closing price crosses the active dynamic band. If the price closes above the upper band, the trend shifts bullish, and the lower band becomes the active support. Conversely, closing below the lower band shifts the trend bearish, making the upper band the active resistance.
● The Filter Matrix
A signal is only generated when a trend flip aligns with all activated filters:
🎨 Visual Guide
● Chart Elements
● Filter Dashboard
Located in the top right corner of the chart, this HUD (Heads-Up Display) provides a real-time status check of your system.
📖 How to Use
• Interpreting the System
To effectively use the Alpha Signal Engine, begin by observing the main trend lines and the color of the cloud. This provides your baseline bias. Do not take trades purely on the band flipping. Instead, rely on the explicit "B" and "S" labels.
• Signal Execution
When a "B" (Buy) or "S" (Sell) label appears, it means the price has successfully flipped the trend AND all user-activated filters in the dashboard are glowing green. This is your entry trigger. The active trend line (the teal line for longs, the pink line for shorts) serves as an ideal, dynamic stop-loss placement.
• Customizing the Engine
The system is designed to be tuned. If you are trading a highly liquid asset like major forex pairs, you may want to enable the ADX and HTF filters to catch long, sustained moves. If you are trading volatile crypto assets, enabling the Volume Surge and Candle Body filters can help you avoid fake-outs and trap wicks. Monitor the on-chart dashboard to see which filters are keeping you out of bad trades and adjust your settings accordingly.
⚙️ Inputs and Settings
• Supertrend Settings
• Filter Settings
• Webhook Action Names
These text inputs allow you to define specific payload strings (e.g., "long", "closeshort") that the indicator will output via JSON alerts, perfectly formatting the data for third-party automation services like 3Commas or PineConnector.
🔍 Deconstruction of the Underlying Scientific and Academic Framework
The Alpha Signal Engine is grounded in several well-documented tenets of quantitative financial analysis and statistical market theory.
● Volatility-Adjusted Trailing Stops
The foundation of the indicator relies on the Average True Range (ATR), introduced by J. Welles Wilder Jr. The ATR is a measure of the degree of price volatility. By tying the trailing stop (the dynamic band) to the ATR, the system acknowledges the statistical reality of market variance. The innovation here is the dynamic multiplier. By adjusting the distance based on the normalized rate of change (momentum), the script attempts to solve the lagging nature of fixed-multiplier trailing stops, utilizing principles found in adaptive moving averages (like Kaufman's AMA), where sensitivity increases alongside directional conviction.
● Multi-Dimensional Confluence Theory
The filtering engine operates on the academic principle of conditional probability and confluence. In market microstructure, no single indicator holds a permanent statistical edge.
By chaining these disparate mathematical models (trend, momentum, volume, volatility) via Boolean logic, the system mathematically reduces the frequency of trades while theoretically increasing the probability of the remaining sample size.
⚠️ Disclaimer
All provided scripts and indicators are strictly for educational exploration and must not be interpreted as financial advice or a recommendation to execute trades. I expressly disclaim all liability for any financial losses or damages that may result, directly or indirectly, from the reliance on or application of these tools. Market participation carries inherent risk where past performance never guarantees future returns, leaving all investment decisions and due diligence solely at your own discretion.
✨ Originality and Utility
● A Dynamic, Adaptive Baseline
Standard trailing stop or trend indicators, such as the classic Supertrend, typically use a static multiplier against the Average True Range (ATR). The Alpha Signal Engine innovates by introducing a "Dynamic Factor." This factor continuously adapts the band's distance from price by factoring in the current baseline multiplier, the relative volatility (ATR normalized by price), and the immediate price change momentum. This allows the bands to tighten during periods of strong, directional momentum and widen during erratic volatility, providing a more responsive and intelligent trailing mechanism.
● The Six-Pillar Filtering Gateway
The true utility of this indicator lies in its modular filtering engine. Traders often have to clutter their charts with half a dozen indicators to confirm a setup. This script centralizes that logic. Users can selectively enable or disable filters based on their specific asset and trading style, turning the indicator into a customizable algorithmic engine. Whether you need volume confirmation, ADX trend strength, or simple RSI momentum, the script handles the complex boolean logic internally and only outputs a signal when your precise market conditions are met.
🔬 Methodology and Concepts
● Dynamic Factor Calculation
The indicator establishes its baseline trend using an upper and lower band. The distance of these bands from the median price is dictated by a dynamically calculated factor. This factor is the sum of a base value, a volatility component (ATR divided by Close, scaled by a user weight), and a price movement component (percentage change of the close, scaled by a user weight). This raw factor is then smoothed using a Simple Moving Average (SMA) to prevent erratic band shifts.
● Trend Determination
The trend direction flips when the closing price crosses the active dynamic band. If the price closes above the upper band, the trend shifts bullish, and the lower band becomes the active support. Conversely, closing below the lower band shifts the trend bearish, making the upper band the active resistance.
● The Filter Matrix
A signal is only generated when a trend flip aligns with all activated filters:
- HTF Alignment: Uses the request context to pull the trend direction from a higher timeframe, ensuring you are not trading against the macro trend.
- ADX Trending: Measures the Average Directional Index to ensure the market is in an active trending phase (above a defined threshold) rather than a sideways chop.
- Volume Surge: Compares current volume against a Volume SMA. The current bar must exhibit a volume spike greater than the defined multiplier to confirm institutional participation.
- RSI Momentum: A simple but effective gatekeeper requiring the Relative Strength Index to be above 50 for longs and below 50 for shorts.
- ATR Volatility Regime: Compares the current ATR against a 50-period SMA of the ATR. It ensures the market is operating within a "normal" volatility ratio, preventing entries during extreme, unpredictable volatility spikes or dead, illiquid periods.
- Candle Body Strength: Calculates the absolute size of the candle body (Open to Close) and mandates it must be larger than a specific fraction of the ATR, ensuring the signal candle has true directional conviction.
🎨 Visual Guide
● Chart Elements
- Up Trend Line: Displayed as a solid, teal-colored line trailing below the price action during a bullish phase. It acts as dynamic support.
- Down Trend Line: Displayed as a solid, bright pink/red line trailing above the price action during a bearish phase. It acts as dynamic resistance.
- Trend Cloud (Fill): A colored gradient fill exists between the median price and the active trend line. A teal cloud visually represents bullish dominance, while a pink/red cloud represents bearish dominance.
- Buy Signals: Indicated by small, teal "B" labels positioned below the signal candle.
- Sell Signals: Indicated by small, pink/red "S" labels positioned above the signal candle.
● Filter Dashboard
Located in the top right corner of the chart, this HUD (Heads-Up Display) provides a real-time status check of your system.
- The left column lists the available filters (HTF Align, ADX Trend, Vol Surge, RSI Gate, ATR Regime, Body Str).
- The right column displays the current status of each filter.
- A gray "OFF" indicator means the user has disabled the filter in the settings.
- A green "ON" or "Aligned" text indicates the condition is currently met.
- A red "Opposed" or unlit indicator means the condition is active but currently failing to meet the required criteria.
- The bottom rows clearly state the current overarching trend direction and whether a signal is pending or waiting.
📖 How to Use
• Interpreting the System
To effectively use the Alpha Signal Engine, begin by observing the main trend lines and the color of the cloud. This provides your baseline bias. Do not take trades purely on the band flipping. Instead, rely on the explicit "B" and "S" labels.
• Signal Execution
When a "B" (Buy) or "S" (Sell) label appears, it means the price has successfully flipped the trend AND all user-activated filters in the dashboard are glowing green. This is your entry trigger. The active trend line (the teal line for longs, the pink line for shorts) serves as an ideal, dynamic stop-loss placement.
• Customizing the Engine
The system is designed to be tuned. If you are trading a highly liquid asset like major forex pairs, you may want to enable the ADX and HTF filters to catch long, sustained moves. If you are trading volatile crypto assets, enabling the Volume Surge and Candle Body filters can help you avoid fake-outs and trap wicks. Monitor the on-chart dashboard to see which filters are keeping you out of bad trades and adjust your settings accordingly.
⚙️ Inputs and Settings
• Supertrend Settings
- ATR Length: The lookback period for calculating the Average True Range.
- Base Factor: The starting multiplier for the dynamic bands.
- Volatility & Price Change Weights: Determines how aggressively the bands react to sudden spikes in relative volatility and price momentum.
- Factor Smoothing: Applies an SMA to the final dynamic multiplier to keep the bands stable.
• Filter Settings
- Enable HTF Alignment: Toggle and define the higher timeframe (e.g., Daily) to align with.
- ADX Settings: Toggle the filter, define the lookback length, and set the minimum trend strength threshold (default is 20).
- Volume Settings: Toggle the filter, define the Volume MA length, and set the multiplier required to classify as a "surge."
- RSI Settings: Toggle the filter and set the RSI lookback length.
- ATR Regime Settings: Define the minimum and maximum acceptable ratios of current ATR versus historical ATR.
- Candle Body Settings: Define the minimum required size of the candle body as a fraction of the current ATR.
• Webhook Action Names
These text inputs allow you to define specific payload strings (e.g., "long", "closeshort") that the indicator will output via JSON alerts, perfectly formatting the data for third-party automation services like 3Commas or PineConnector.
🔍 Deconstruction of the Underlying Scientific and Academic Framework
The Alpha Signal Engine is grounded in several well-documented tenets of quantitative financial analysis and statistical market theory.
● Volatility-Adjusted Trailing Stops
The foundation of the indicator relies on the Average True Range (ATR), introduced by J. Welles Wilder Jr. The ATR is a measure of the degree of price volatility. By tying the trailing stop (the dynamic band) to the ATR, the system acknowledges the statistical reality of market variance. The innovation here is the dynamic multiplier. By adjusting the distance based on the normalized rate of change (momentum), the script attempts to solve the lagging nature of fixed-multiplier trailing stops, utilizing principles found in adaptive moving averages (like Kaufman's AMA), where sensitivity increases alongside directional conviction.
● Multi-Dimensional Confluence Theory
The filtering engine operates on the academic principle of conditional probability and confluence. In market microstructure, no single indicator holds a permanent statistical edge.
- The HTF filter is rooted in Dow Theory, prioritizing the primary trend over secondary reactions.
- The ADX filter utilizes Wilder's Directional Movement Index to mathematically separate trending environments from mean-reverting environments, applying a statistical threshold to directional strength.
- The Volume Surge filter relies on the Volume Price Trend concepts, positing that significant price movements must be sponsored by outsized volume to validate institutional participation and avoid anomalous low-liquidity spikes.
- The ATR Regime filter applies mean-reverting principles to volatility itself (volatility clustering), ensuring that entries are only taken when the variance of the asset is within historically "normal" parameters, avoiding the fat tails of extreme market shocks.
By chaining these disparate mathematical models (trend, momentum, volume, volatility) via Boolean logic, the system mathematically reduces the frequency of trades while theoretically increasing the probability of the remaining sample size.
⚠️ Disclaimer
All provided scripts and indicators are strictly for educational exploration and must not be interpreted as financial advice or a recommendation to execute trades. I expressly disclaim all liability for any financial losses or damages that may result, directly or indirectly, from the reliance on or application of these tools. Market participation carries inherent risk where past performance never guarantees future returns, leaving all investment decisions and due diligence solely at your own discretion.
開源腳本
秉持TradingView一貫精神,這個腳本的創作者將其設為開源,以便交易者檢視並驗證其功能。向作者致敬!您可以免費使用此腳本,但請注意,重新發佈代碼需遵守我們的社群規範。

💡 Proprietary indicators. Original research. Built by analysts who trade.
📢 Free Telegram: t.me/MarkitTick_Updates
👑 Premium: markittick.com
📢 Free Telegram: t.me/MarkitTick_Updates
👑 Premium: markittick.com
免責聲明
這些資訊和出版物並非旨在提供,也不構成TradingView提供或認可的任何形式的財務、投資、交易或其他類型的建議或推薦。請閱讀使用條款以了解更多資訊。
開源腳本
秉持TradingView一貫精神,這個腳本的創作者將其設為開源,以便交易者檢視並驗證其功能。向作者致敬!您可以免費使用此腳本,但請注意,重新發佈代碼需遵守我們的社群規範。
💡 Proprietary indicators. Original research. Built by analysts who trade.
📢 Free Telegram: t.me/MarkitTick_Updates
👑 Premium: markittick.com
📢 Free Telegram: t.me/MarkitTick_Updates
👑 Premium: markittick.com
免責聲明
這些資訊和出版物並非旨在提供,也不構成TradingView提供或認可的任何形式的財務、投資、交易或其他類型的建議或推薦。請閱讀使用條款以了解更多資訊。