OPEN-SOURCE SCRIPT
RSI Trendlines and Divergences with alerts
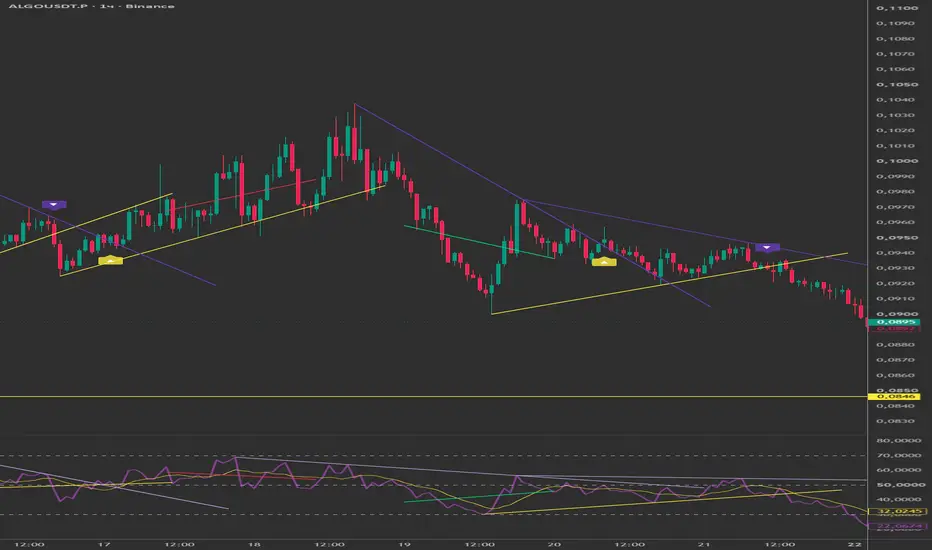
RSI TRENDLINES AND DIVERGENCES
OVERVIEW
An all-in-one RSI toolkit that combines four independent analytical layers in a single indicator: automatic trendlines drawn on the RSI itself, automatic support/resistance trendlines on price, classic pivot-based RSI divergence, and a separate regression-based divergence engine. Instead of stacking several scripts, you get a coordinated set of momentum and structure tools that can confirm one another.
WHAT IT DOES
1. RSI Trendlines (oscillator pane)
Detects pivot highs and pivot lows directly on the RSI line and connects consecutive pivots into dynamic trendlines. Descending lines off RSI peaks act as momentum resistance; ascending lines off RSI troughs act as momentum support. A tolerance band (in RSI points) is drawn around each line and filled, and a break is only flagged when RSI crosses the line beyond that tolerance — which filters out noise. Counter-direction lines (for example, a rising line off highs) are automatically discarded, so only meaningful trendlines stay on the pane.
2. Price Trendlines (main chart)
The same pivot-to-pivot logic applied to price highs and lows, drawn as support and resistance lines directly on the price chart. Breaks use a percentage-based tolerance to reduce false signals, and optional up/down triangle labels mark confirmed breakouts.
3. Pivot Divergence
Classic regular divergence between price and RSI. A lower low in price against a higher low in RSI marks bullish divergence; a higher high in price against a lower high in RSI marks bearish divergence. Detection is limited to a recent window so stale readings are ignored, and results are shown as connecting lines and Bull/Bear labels on the RSI.
4. Regression Divergence (independent method)
A separate, math-driven divergence engine that fits a least-squares linear regression to both RSI and price over a configurable window. When the two regressions slope in opposite directions, and the move clears a minimum magnitude filter, a regression divergence is flagged with lines on both the RSI and the price, plus optional labels. Because it does not rely on pivots, it often catches divergences the pivot method misses, and vice versa.
SETTINGS
- RSI Settings: RSI length, signal SMA length, and source.
- Pivot Settings (Trend): left/right pivot bars, line extension after the 2nd pivot, break tolerance, and max trendlines per type. All lines share TradingView's 500-line budget, so the trendline and regression limits are balanced against each other.
- Price Trendline Settings: independent pivot bars, extension, and a percentage-based break tolerance.
- Divergence Settings: enable/disable plus pivot length for the classic method.
- Regression Divergence: window length, minimum RSI slope, line and label toggles, number of stored line pairs, and colors.
- Style Settings: full color and transparency control for every element on both the RSI pane and the price chart.
ALERTS
Ready-made alert conditions for: bullish and bearish pivot divergence, upper and lower RSI trendline breaks, price resistance and support breaks, and regression bullish and bearish divergence.
HOW TO USE
Use the trendline breaks to time momentum shifts, the price trendlines for structural support and resistance, and treat agreement between the two divergence engines as stronger confluence. Combine these signals with your own market-structure and trend context — the tools highlight conditions, they are not standalone buy or sell calls.
CREDITS
Built on the RSI trendline concept by Uncle_the_shooter. The regression-divergence module is adapted from faytterro's "RSI Divergence." Thanks to both authors.
This script is for educational and informational purposes only and is not financial advice. Test on your own data and always manage risk.
OVERVIEW
An all-in-one RSI toolkit that combines four independent analytical layers in a single indicator: automatic trendlines drawn on the RSI itself, automatic support/resistance trendlines on price, classic pivot-based RSI divergence, and a separate regression-based divergence engine. Instead of stacking several scripts, you get a coordinated set of momentum and structure tools that can confirm one another.
WHAT IT DOES
1. RSI Trendlines (oscillator pane)
Detects pivot highs and pivot lows directly on the RSI line and connects consecutive pivots into dynamic trendlines. Descending lines off RSI peaks act as momentum resistance; ascending lines off RSI troughs act as momentum support. A tolerance band (in RSI points) is drawn around each line and filled, and a break is only flagged when RSI crosses the line beyond that tolerance — which filters out noise. Counter-direction lines (for example, a rising line off highs) are automatically discarded, so only meaningful trendlines stay on the pane.
2. Price Trendlines (main chart)
The same pivot-to-pivot logic applied to price highs and lows, drawn as support and resistance lines directly on the price chart. Breaks use a percentage-based tolerance to reduce false signals, and optional up/down triangle labels mark confirmed breakouts.
3. Pivot Divergence
Classic regular divergence between price and RSI. A lower low in price against a higher low in RSI marks bullish divergence; a higher high in price against a lower high in RSI marks bearish divergence. Detection is limited to a recent window so stale readings are ignored, and results are shown as connecting lines and Bull/Bear labels on the RSI.
4. Regression Divergence (independent method)
A separate, math-driven divergence engine that fits a least-squares linear regression to both RSI and price over a configurable window. When the two regressions slope in opposite directions, and the move clears a minimum magnitude filter, a regression divergence is flagged with lines on both the RSI and the price, plus optional labels. Because it does not rely on pivots, it often catches divergences the pivot method misses, and vice versa.
SETTINGS
- RSI Settings: RSI length, signal SMA length, and source.
- Pivot Settings (Trend): left/right pivot bars, line extension after the 2nd pivot, break tolerance, and max trendlines per type. All lines share TradingView's 500-line budget, so the trendline and regression limits are balanced against each other.
- Price Trendline Settings: independent pivot bars, extension, and a percentage-based break tolerance.
- Divergence Settings: enable/disable plus pivot length for the classic method.
- Regression Divergence: window length, minimum RSI slope, line and label toggles, number of stored line pairs, and colors.
- Style Settings: full color and transparency control for every element on both the RSI pane and the price chart.
ALERTS
Ready-made alert conditions for: bullish and bearish pivot divergence, upper and lower RSI trendline breaks, price resistance and support breaks, and regression bullish and bearish divergence.
HOW TO USE
Use the trendline breaks to time momentum shifts, the price trendlines for structural support and resistance, and treat agreement between the two divergence engines as stronger confluence. Combine these signals with your own market-structure and trend context — the tools highlight conditions, they are not standalone buy or sell calls.
CREDITS
Built on the RSI trendline concept by Uncle_the_shooter. The regression-divergence module is adapted from faytterro's "RSI Divergence." Thanks to both authors.
This script is for educational and informational purposes only and is not financial advice. Test on your own data and always manage risk.
開源腳本
秉持TradingView一貫精神,這個腳本的創作者將其設為開源,以便交易者檢視並驗證其功能。向作者致敬!您可以免費使用此腳本,但請注意,重新發佈代碼需遵守我們的社群規範。

免責聲明
這些資訊和出版物並非旨在提供,也不構成TradingView提供或認可的任何形式的財務、投資、交易或其他類型的建議或推薦。請閱讀使用條款以了解更多資訊。
免責聲明
這些資訊和出版物並非旨在提供,也不構成TradingView提供或認可的任何形式的財務、投資、交易或其他類型的建議或推薦。請閱讀使用條款以了解更多資訊。