OPEN-SOURCE SCRIPT
Volume Pressure & Support/Resistance [Proxy]
1.Spread & Close Position (Execution at Ask/Bid): We calculate the candle's spread (high - low). A close near the high indicates buying pressure (trades clearing the Ask), while a narrow spread with unusually high volume often indicates absorption (limit orders absorbing market selling).
2.Support & Resistance: We dynamically identify support and resistance levels using pivot highs and lows to define where "trend continuations" and "reversals" are likely to occur.
3.Trend Continuation Buy (Breakout): Fires when the price crosses above a known resistance level, accompanied by high volume and a strong close (proxy for clearing large Asks at resistance).
4.Reversal Buy (Absorption): Fires when the price drops to or slightly below a known support level but manages a strong close on high volume. This serves as a proxy for a large, replenishing Bid absorbing downward pressure at support.
How to Use It
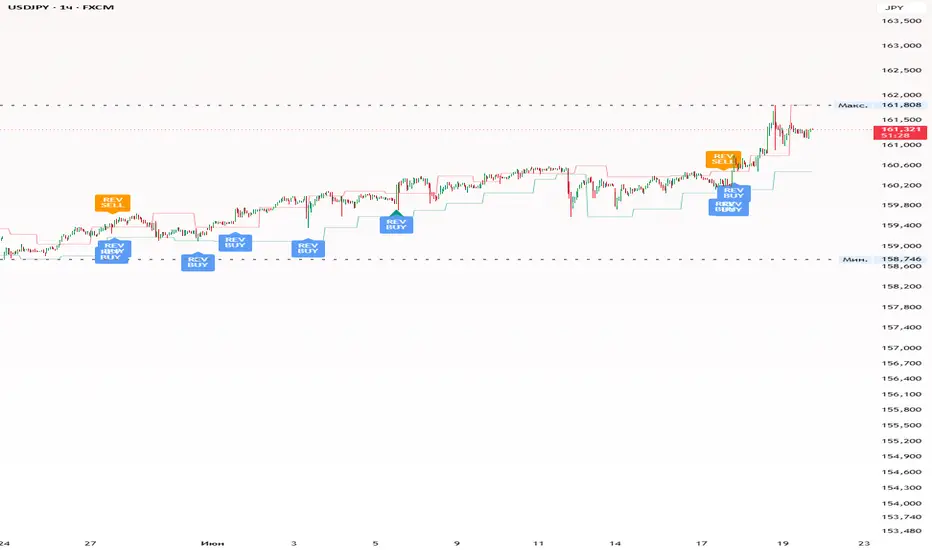
Blue 'REV' Labels represent Reversal Buys. Watch for these when the stock is bouncing off the green Support lines.
Green Triangles represent Trend Continuation Buys. Watch for these when the stock is breaking above the red Resistance lines.
You can adjust the Pivot Length (how far back to look for support/resistance) and the High Volume Multiplier in the indicator settings to fine-tune the strictness of the signals.
Here is how the new sell proxies work:
Trend Continuation Sell (Breakdown):
Fires when the price crosses below a known support level (proxy for a large Bid being cleared out).
Confirmed by high volume and a weak close (closing near the bottom of the candle's spread), which acts as a proxy for trades executing predominantly at the Bid price.
Reversal Sell (Absorption at Resistance):
Fires when the price pushes up into a known resistance level but is met with high volume and a weak close.
This represents a lack of further price appreciation despite rising volume, acting as a proxy for a large, replenishing Ask absorbing the buying pressure.
Visual Updates:
*Red Triangles: Indicate a Trend Continuation Sell (breakdown below support).
*Orange 'REV SELL' Labels: Indicate a Reversal Sell (price stopping at resistance, signaling absorption by sellers).
Adjustable Sensitivity Inputs:
I added a new settings group called "Volume & Sensitivity".
You can now adjust the Strong Close Threshold and Weak Close Threshold. For example, setting the strong close threshold to 0.8 means the candle must close in the top 20% of its range to count as a proxy for "execution at the Ask" (stricter than before).
The High Volume Multiplier and Volume Moving Average Length are now fully customizable so you can decide exactly what constitutes a "high volume" spike.
Volume Delta Proxy:
*Since Pine Script doesn't have native real-time bid/ask volume delta on the chart directly, I created a mathematical proxy for it.
*It estimates how much of the bar's volume was "buying" versus "selling" based on where the close is within the high-low spread.
*A new toggle called Use Volume Delta Proxy is enabled by default.
*If enabled, a Buy Signal will only fire if the estimated buying volume was greater than the selling volume (positive delta). A Sell Signal will only fire if the estimated selling volume outweighed the buying volume (negative delta).
開源腳本
秉持TradingView一貫精神,這個腳本的創作者將其設為開源,以便交易者檢視並驗證其功能。向作者致敬!您可以免費使用此腳本,但請注意,重新發佈代碼需遵守我們的社群規範。

免責聲明
這些資訊和出版物並非旨在提供,也不構成TradingView提供或認可的任何形式的財務、投資、交易或其他類型的建議或推薦。請閱讀使用條款以了解更多資訊。
免責聲明
這些資訊和出版物並非旨在提供,也不構成TradingView提供或認可的任何形式的財務、投資、交易或其他類型的建議或推薦。請閱讀使用條款以了解更多資訊。