OPEN-SOURCE SCRIPT
Sideways Zone Breakout
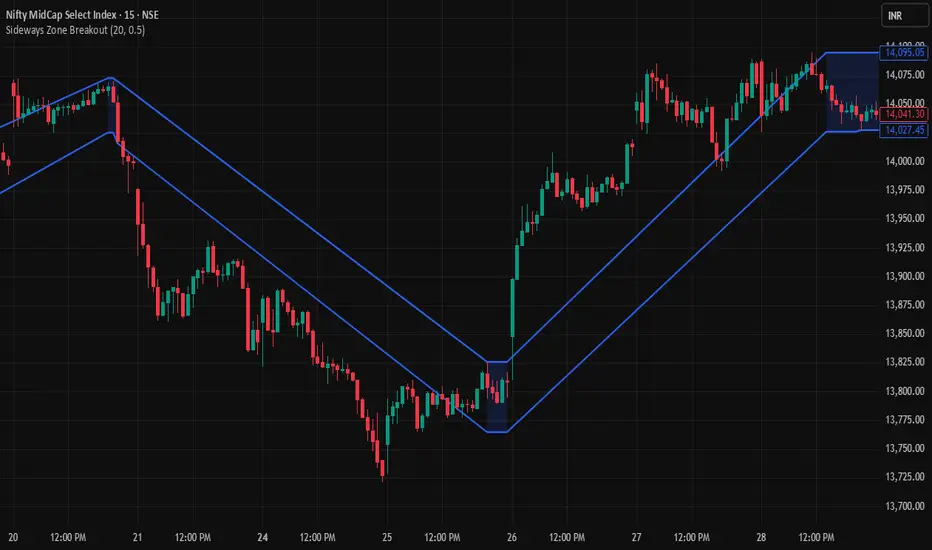
Sideways Zone Breakout is a price action–based indicator designed to identify low-volatility consolidation zones and highlight confirmed breakout opportunities. Consolidation phases often occur before strong directional moves, and this indicator helps traders visually detect those phases and act on potential breakouts.
The indicator analyzes price over a user-defined lookback period and calculates the highest high and lowest low to determine the total range. If the range remains within a user-defined percentage threshold, the market is considered to be in a sideways or consolidation state. During this phase, the indicator plots a clearly defined zone on the chart representing the consolidation range.
Once the market breaks above or below this zone and the candle closes outside the boundary, the indicator generates a breakout signal. A green upward arrow appears when price breaks above the consolidation zone, indicating a potential bullish breakout. A red downward arrow appears when price breaks below the consolidation zone, indicating a potential bearish breakout. Signals are confirmed only on candle close, which helps reduce false or premature signals.
This indicator can be used on any symbol and any timeframe, including stocks, indices, forex, and cryptocurrencies. It is useful for intraday trading, swing trading, and trend-following strategies.
Important: If no zones or signals appear on your chart, adjust the "Sideways Lookback" and "Max Range %" settings according to the symbol and timeframe. Different markets and volatility conditions require different parameter values for optimal detection.
This tool helps traders identify consolidation zones, anticipate breakout movements, and improve entry timing based on market structure and volatility contraction.
The indicator analyzes price over a user-defined lookback period and calculates the highest high and lowest low to determine the total range. If the range remains within a user-defined percentage threshold, the market is considered to be in a sideways or consolidation state. During this phase, the indicator plots a clearly defined zone on the chart representing the consolidation range.
Once the market breaks above or below this zone and the candle closes outside the boundary, the indicator generates a breakout signal. A green upward arrow appears when price breaks above the consolidation zone, indicating a potential bullish breakout. A red downward arrow appears when price breaks below the consolidation zone, indicating a potential bearish breakout. Signals are confirmed only on candle close, which helps reduce false or premature signals.
This indicator can be used on any symbol and any timeframe, including stocks, indices, forex, and cryptocurrencies. It is useful for intraday trading, swing trading, and trend-following strategies.
Important: If no zones or signals appear on your chart, adjust the "Sideways Lookback" and "Max Range %" settings according to the symbol and timeframe. Different markets and volatility conditions require different parameter values for optimal detection.
This tool helps traders identify consolidation zones, anticipate breakout movements, and improve entry timing based on market structure and volatility contraction.
開源腳本
秉持TradingView一貫精神,這個腳本的創作者將其設為開源,以便交易者檢視並驗證其功能。向作者致敬!您可以免費使用此腳本,但請注意,重新發佈代碼需遵守我們的社群規範。

For access & queries: algochiefsupport@gmail.com
免責聲明
這些資訊和出版物並非旨在提供,也不構成TradingView提供或認可的任何形式的財務、投資、交易或其他類型的建議或推薦。請閱讀使用條款以了解更多資訊。
開源腳本
秉持TradingView一貫精神,這個腳本的創作者將其設為開源,以便交易者檢視並驗證其功能。向作者致敬!您可以免費使用此腳本,但請注意,重新發佈代碼需遵守我們的社群規範。
For access & queries: algochiefsupport@gmail.com
免責聲明
這些資訊和出版物並非旨在提供,也不構成TradingView提供或認可的任何形式的財務、投資、交易或其他類型的建議或推薦。請閱讀使用條款以了解更多資訊。