Session VWAP with Measured Band Reach
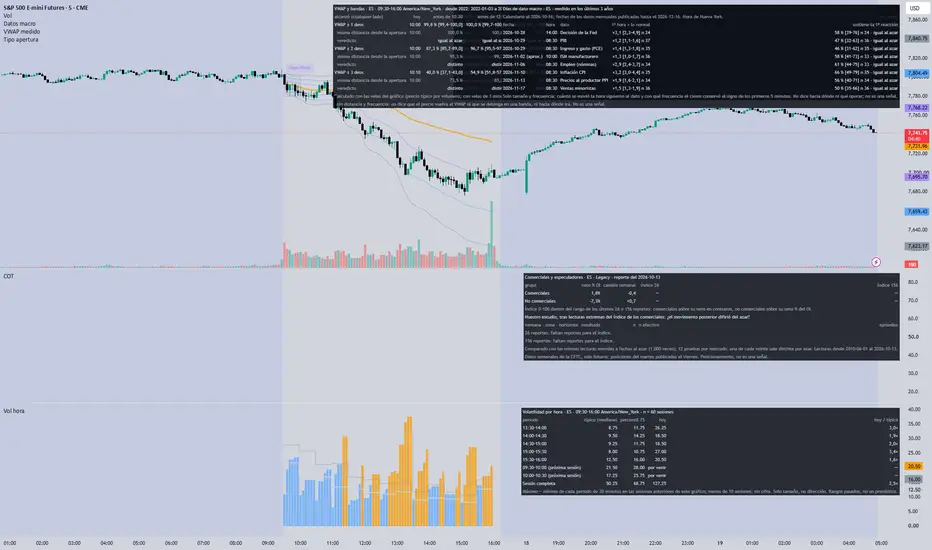
Session VWAP of the regular session with bands at 1, 2 and 3 standard deviations, computed from the chart's bars, and how often each band was reached by 10:30, 12:00, 14:00 and the close in this market, against the same distance measured from the session's open.
WHAT IT SHOWS
- The VWAP line and the ±1, ±2 and ±3 standard deviation bands of today's regular session (09:30-16:00 New York).
- A table, per band: the share of sessions (since 2022) in which a bar reached the band before each checkpoint, with its sample size (n) and 95% interval, next to the share that reached the same distance from the open. When the interval of the difference holds zero, it reads "same as chance": the VWAP band was reached as often as any point that far from the open.
- Today: whether and when each band was reached.
HOW IT WORKS
- Each bar adds its typical price ((high + low + close) / 3) weighted by its volume from the first bar of the regular session: VWAP = sum(price x volume) / sum(volume). The bands are the VWAP plus and minus k standard deviations of those prices around the VWAP, weighted by volume. It is computed from the chart's bars, so it approximates a VWAP built trade by trade; on a 1-minute chart it follows the same arithmetic as our table.
- A touch counts from 10:00 (the first 30 minutes build the bands) and compares each bar with the band known at the end of the previous bar, on either side.
- The statistics are embedded from our own measurement on historical 1-minute data (8 markets) and refreshed with each update of the script; other markets get the line without the table.
LIMITS
- Distance and frequency only. It does not say that price returns to the VWAP or stops at a band, and it is not a signal or a recommendation.
- In the measured markets the outer bands were reached less often than the same distance from the open, because the VWAP moves with price.
Languages: Spanish, English and Portuguese (input). Alerts: band 1, 2 or 3 reached for the first time today.
WHAT IT SHOWS
- The VWAP line and the ±1, ±2 and ±3 standard deviation bands of today's regular session (09:30-16:00 New York).
- A table, per band: the share of sessions (since 2022) in which a bar reached the band before each checkpoint, with its sample size (n) and 95% interval, next to the share that reached the same distance from the open. When the interval of the difference holds zero, it reads "same as chance": the VWAP band was reached as often as any point that far from the open.
- Today: whether and when each band was reached.
HOW IT WORKS
- Each bar adds its typical price ((high + low + close) / 3) weighted by its volume from the first bar of the regular session: VWAP = sum(price x volume) / sum(volume). The bands are the VWAP plus and minus k standard deviations of those prices around the VWAP, weighted by volume. It is computed from the chart's bars, so it approximates a VWAP built trade by trade; on a 1-minute chart it follows the same arithmetic as our table.
- A touch counts from 10:00 (the first 30 minutes build the bands) and compares each bar with the band known at the end of the previous bar, on either side.
- The statistics are embedded from our own measurement on historical 1-minute data (8 markets) and refreshed with each update of the script; other markets get the line without the table.
LIMITS
- Distance and frequency only. It does not say that price returns to the VWAP or stops at a band, and it is not a signal or a recommendation.
- In the measured markets the outer bands were reached less often than the same distance from the open, because the VWAP moves with price.
Languages: Spanish, English and Portuguese (input). Alerts: band 1, 2 or 3 reached for the first time today.

Perfiltrade — futures analysis with the sample in plain sight: historical base rates, Market Profile and COT across 30 instruments. No signals, no black boxes. perfiltrade.com
免責聲明
這些資訊和出版物並非旨在提供,也不構成TradingView提供或認可的任何形式的財務、投資、交易或其他類型的建議或推薦。請閱讀使用條款以了解更多資訊。
Perfiltrade — futures analysis with the sample in plain sight: historical base rates, Market Profile and COT across 30 instruments. No signals, no black boxes. perfiltrade.com
免責聲明
這些資訊和出版物並非旨在提供,也不構成TradingView提供或認可的任何形式的財務、投資、交易或其他類型的建議或推薦。請閱讀使用條款以了解更多資訊。