OPEN-SOURCE SCRIPT
ADR Contraction Tightness
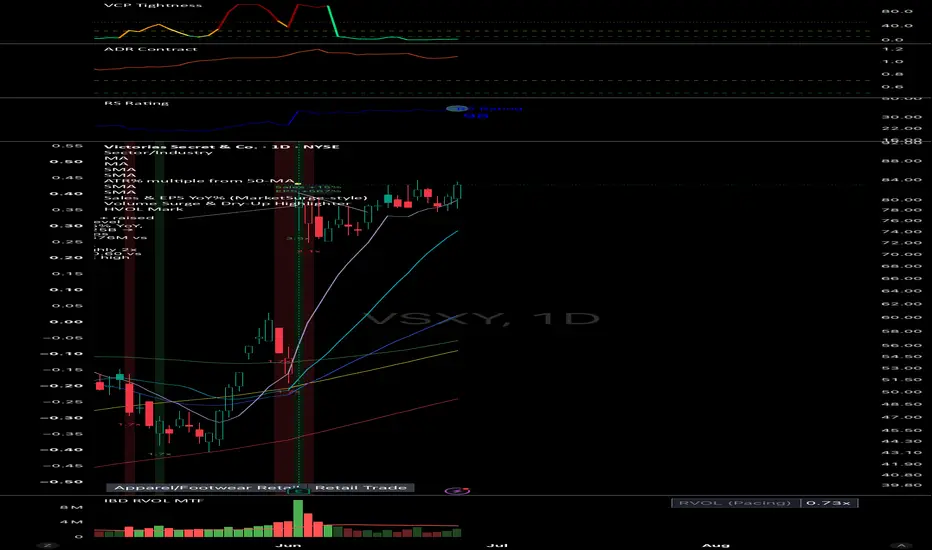
HAT IT IS
// Measures how much a stock's recent daily range has dried up versus its
// ~2.5-month baseline. A single ratio:
//
// bar_range_pct = (high - low) / low * 100 // each bar's range %
// adr_pct_short = ta.sma(bar_range_pct, 20) // recent avg daily range %
// adr_pct_long = ta.sma(bar_range_pct, 50) // baseline avg daily range %
// contraction_ratio = adr_pct_short / adr_pct_long // LOWER = TIGHTER
//
// "Tight base" when contraction_ratio <= 1.00
// "Super-tight" when contraction_ratio <= 0.70
//
// STUDY PROVENANCE
// This is measure B_0.7 ("absolute ADR% contraction") — the tightness
// measure that won the ATR Extension Study tightness-measure bake-off
// (engine: atr_phase7.py §15.6, branch atr-study). In that study B_0.7 was
// the most selective qualifier of the +50% movers: best P(+50%) lift and
// ~10 days faster to the move, versus the old normalized 0–100 VCP score
// which fired on ~99% of names. Lower = tighter. This replaces the VCP
// Tightness Score pane and is built to feed a TradingView Pine Screener.
// Measures how much a stock's recent daily range has dried up versus its
// ~2.5-month baseline. A single ratio:
//
// bar_range_pct = (high - low) / low * 100 // each bar's range %
// adr_pct_short = ta.sma(bar_range_pct, 20) // recent avg daily range %
// adr_pct_long = ta.sma(bar_range_pct, 50) // baseline avg daily range %
// contraction_ratio = adr_pct_short / adr_pct_long // LOWER = TIGHTER
//
// "Tight base" when contraction_ratio <= 1.00
// "Super-tight" when contraction_ratio <= 0.70
//
// STUDY PROVENANCE
// This is measure B_0.7 ("absolute ADR% contraction") — the tightness
// measure that won the ATR Extension Study tightness-measure bake-off
// (engine: atr_phase7.py §15.6, branch atr-study). In that study B_0.7 was
// the most selective qualifier of the +50% movers: best P(+50%) lift and
// ~10 days faster to the move, versus the old normalized 0–100 VCP score
// which fired on ~99% of names. Lower = tighter. This replaces the VCP
// Tightness Score pane and is built to feed a TradingView Pine Screener.
開源腳本
秉持TradingView一貫精神,這個腳本的創作者將其設為開源,以便交易者檢視並驗證其功能。向作者致敬!您可以免費使用此腳本,但請注意,重新發佈代碼需遵守我們的社群規範。

免責聲明
這些資訊和出版物並非旨在提供,也不構成TradingView提供或認可的任何形式的財務、投資、交易或其他類型的建議或推薦。請閱讀使用條款以了解更多資訊。
免責聲明
這些資訊和出版物並非旨在提供,也不構成TradingView提供或認可的任何形式的財務、投資、交易或其他類型的建議或推薦。請閱讀使用條款以了解更多資訊。