OPEN-SOURCE SCRIPT
SteveFi Trade Cockpit
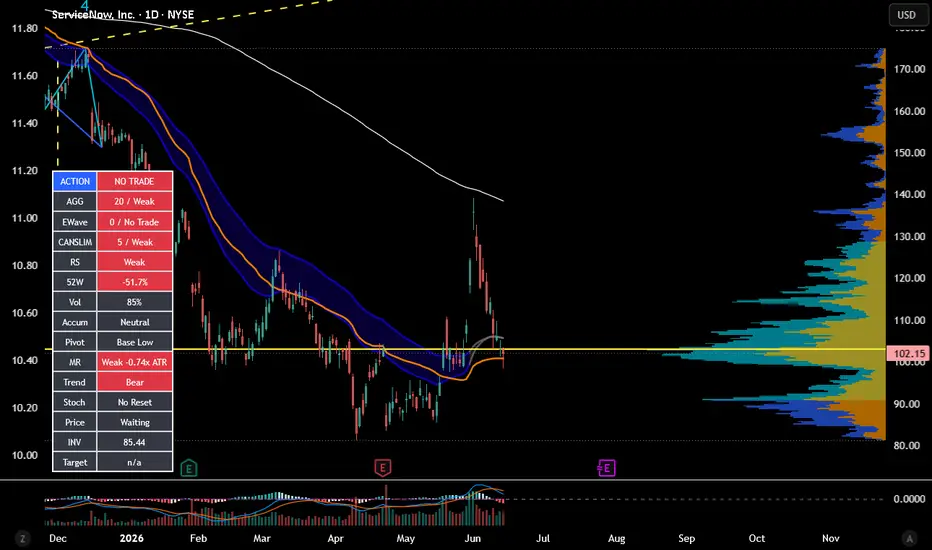
The dashboard has 15 rows:
| Row | Purpose |
| ----------- | ---------------------------------------------------- |
| **ACTION** | Final decision output |
| **AGG** | Weighted overall score using all 13 major attributes |
| **EWave** | Elliott/Wolfe/Stoch/RSI-style timing score |
| **CANSLIM** | CANSLIM-style technical quality score |
| **RS** | Relative strength vs QQQ |
| **52W** | Distance from 52-week high |
| **Vol** | Current volume vs average volume |
| **Accum** | Accumulation vs distribution pressure |
| **Pivot** | Whether price is near a breakout/pivot area |
| **MR** | Mean reversion / extension risk |
| **Trend** | Overall trend structure |
| **Stoch** | Momentum reset/exhaustion |
| **Price** | Price action confirmation |
| **INV** | Invalidation level |
| **Target** | Potential upside target |
The color coding is:
| Color | Meaning |
| ------------- | ---------------------------------------------- |
| **Green** | Positive / bullish |
| **Orange** | Watch / caution / constructive but not perfect |
| **Dark gray** | Neutral / waiting |
| **Red** | Negative / risk / failure |
---
# 1. ACTION
This is the **main output**.
Possible values:
| ACTION | Meaning |
| ------------------ | --------------------------------------------------------------------------------- |
| **BUY TRIGGER** | Aggregate score is strong, price confirms, not invalidated, and not too stretched |
| **BUY WATCH** | Setup is building, but not fully confirmed |
| **TRIM / CAUTION** | Momentum may be rolling over or price is stretched |
| **WAIT** | Some positives exist, but not enough for action |
| **NO TRADE** | Weak overall setup |
| **INV** | Invalidation level broke. Setup failed. |
The action row is based mostly on **AGG**, not just EWave.
Current logic:
```text
BUY TRIGGER =
AGG >= 80
AND Price is Confirmed
AND not invalidated
AND MR is not Stretched
```
If you turn on:
```text
Require CANSLIM Filter for BUY TRIGGER
```
Then BUY TRIGGER also requires a minimum CANSLIM-quality pass.
That is the stricter version.
---
# 2. AGG
**AGG** is the most important score now.
It is the weighted aggregate score based on all major dashboard factors. This is the “whole chart quality” score.
Current weighting:
| Attribute | Weight |
| ----------- | -----: |
| **CANSLIM** | 21% |
| **RS** | 13% |
| **Price** | 12% |
| **Trend** | 10% |
| **Pivot** | 10% |
| **52W** | 8% |
| **EWave** | 8% |
| **Vol** | 6% |
| **MR** | 5% |
| **Accum** | 3% |
| **Stoch** | 2% |
| **INV** | 1% |
| **Target** | 1% |
This weighting intentionally makes the dashboard **less wave-heavy**.
The thinking is:
> Great stocks with strong RS and confirmed price action matter more than a possible wave count.
AGG grades:
| AGG Score | Grade | Meaning |
| -----------: | ----- | ---------------------------------- |
| **85+** | A+ | Excellent |
| **80–84** | A | Strong / trigger zone if confirmed |
| **70–79** | B | Good watchlist setup |
| **60–69** | C | Developing but not there yet |
| **50–59** | D | Weak / wait |
| **Under 50** | Weak | No trade |
How I’d use it:
| AGG | Interpretation |
| -----------: | ------------------------------------------------- |
| **80+** | Potential action zone |
| **70–79** | Watch closely |
| **60–69** | Setup forming, still early |
| **Under 60** | Probably ignore unless you have a separate thesis |
---
# 3. EWave
**EWave** is the Elliott/Wolfe-style timing score.
It uses:
| EWave Component | Points |
| --------------------------------------------- | -----: |
| Bullish trend context | 20 |
| Fib pullback / possible Wave 2 or Wave 4 zone | 20 |
| RSI bullish divergence | 20 |
| Stoch reset | 15 |
| Wolfe-like structure | 10 |
| Price action confirmation | 10 |
Maximum is **95**.
Dashboard examples:
| EWave | Meaning |
| ----------------------- | ------------------------ |
| **75+ / A** | Strong wave/timing setup |
| **60–74 / B Watch** | Setup is building |
| **40–59 / C Early** | Early or incomplete |
| **Under 40 / No Trade** | Weak timing setup |
Important: **EWave is only 8% of AGG now.**
That means it helps with timing, but it does not dominate the decision.
Best interpretation:
> EWave tells you whether the pullback/structure/timing looks constructive.
It does **not** mean “this is definitely Wave 3.”
---
# 4. CANSLIM
**CANSLIM** is a technical approximation of CANSLIM-style stock quality.
It does not use IBD’s proprietary EPS, sales, or fund ownership data. TradingView cannot reliably recreate that from Pine.
Instead, it uses technical leadership proxies:
| CANSLIM Component | Points |
| ---------------------------- | -----: |
| RS vs benchmark | 20 |
| RS line near/new high | 15 |
| Distance from 52-week high | 15 |
| Volume vs average | 15 |
| Accumulation vs distribution | 15 |
| Pivot/base status | 20 |
Maximum is **100**.
Grades:
| CANSLIM Score | Grade | Meaning |
| ------------: | ----- | -------------------------------------- |
| **80+** | A | Strong CANSLIM-style technical profile |
| **65–79** | B | Good |
| **50–64** | C | Mixed |
| **Under 50** | Weak | Not acting like a leader |
This is now the **largest weight in AGG** at **21%**.
That’s intentional.
The dashboard is saying:
> Stock quality and leadership come first. Timing comes second.
---
# 5. RS
**RS** means relative strength versus the benchmark, currently defaulted to **QQQ**.
It compares the stock’s performance to QQQ over the selected lookback period.
Possible values:
| RS | Meaning |
| ---------- | ------------------------------------------------------------------------- |
| **Strong** | Stock is outperforming QQQ and its RS line is above its RS moving average |
| **OK** | Stock is outperforming QQQ, but not as strongly |
| **Weak** | Stock is underperforming QQQ |
Why this matters:
CANSLIM-style trading wants **leaders**, not laggards.
A stock with **RS Strong** is showing better demand than the market.
Best read:
| RS | Interpretation |
| ------------------ | ------------------------ |
| **Strong / green** | Good leader behavior |
| **OK / orange** | Acceptable but not elite |
| **Weak / red** | Caution |
---
# 6. 52W
**52W** shows how far the stock is from its 52-week high.
Example:
```text
-6.1%
```
Means the stock is 6.1% below its 52-week high.
Interpretation:
| 52W Distance | Meaning |
| ---------------: | ----------------- |
| **0% to -5%** | Very strong |
| **-5% to -15%** | Good / acceptable |
| **-15% to -25%** | Caution |
| **Below -25%** | Weak / damaged |
Why it matters:
CANSLIM usually prefers stocks near highs, not stocks buried far below highs.
A stock near highs is often showing institutional demand.
---
# 7. Vol
**Vol** shows current volume as a percentage of average volume.
Example:
```text
89%
```
Means current volume is 89% of the average volume.
Interpretation:
| Vol | Meaning |
| -------------- | --------------------------------------- |
| **140%+** | Strong demand / breakout-quality volume |
| **100–139%** | Decent |
| **Under 100%** | Light / not confirmed |
Why it matters:
A breakout or strong move is more convincing when volume expands.
For CANSLIM-style buying, strong volume gives confirmation that bigger buyers may be involved.
One note: on intraday bars or during the trading day, volume can look low until the day completes. On daily charts, interpret it best near/after the close.
---
# 8. Accum
**Accum** tries to detect whether the stock has more accumulation or distribution pressure.
It compares:
* Up days on above-average volume
* Down days on above-average volume
Possible values:
| Accum | Meaning |
| ----------- | ----------------------------------------------------- |
| **Accum** | More heavy-volume up days than heavy-volume down days |
| **Neutral** | No clear edge |
| **Distrib** | More heavy-volume down days than up days |
Why it matters:
CANSLIM cares about institutional accumulation.
A stock can look okay on price, but if it is under distribution, the setup is lower quality.
---
# 9. Pivot
**Pivot** tells you where price is relative to a recent breakout/base area.
It uses the recent high over the base lookback period as a rough pivot reference.
Possible values:
| Pivot | Meaning |
| --------------- | ---------------------------------------------- |
| **Breakout** | Price broke above pivot with strong volume |
| **Near Pivot** | Price is within about 5% below the pivot |
| **Above Pivot** | Price is above pivot, but volume is not strong |
| **Extended** | Price is more than about 5% above pivot |
| **Base Low** | Price is not near a useful pivot area |
Why it matters:
The best setups are often near proper buy areas.
For your dashboard:
| Pivot | Interpretation |
| ----------------------- | ------------------ |
| **Breakout / green** | Strong |
| **Near Pivot / orange** | Watch closely |
| **Extended / red** | Be careful chasing |
| **Base Low / gray** | Not actionable yet |
---
# 10. MR
**MR** means mean reversion / extension risk.
It measures how far price is from the fast EMA using ATR.
Example:
```text
Extended 1.73x ATR
```
Means price is 1.73 ATR above the fast EMA.
Possible values:
| MR | Meaning |
| ------------- | ---------------------------------------------------------- |
| **Discount** | Price pulled back below fast EMA but remains above mid EMA |
| **Normal** | Price is within normal range of fast EMA |
| **Extended** | Price is above normal range |
| **Stretched** | Price is too far extended |
| **Weak** | Price is below mid EMA |
| **n/a** | Not enough data |
Why this matters:
This row helps prevent chasing.
A stock can be strong but too extended for a fresh entry.
Important trigger rule:
```text
BUY TRIGGER cannot fire if MR = Stretched
```
That’s a guardrail.
Best read:
| MR | Interpretation |
| --------------------- | ------------------------ |
| **Discount / green** | Pullback zone |
| **Normal / neutral** | Healthy |
| **Extended / orange** | Be careful |
| **Stretched / red** | Probably not a fresh buy |
| **Weak / red** | Structure may be broken |
---
# 11. Trend
**Trend** gives the broader moving-average structure.
Possible values:
| Trend | Meaning |
| --------------- | ------------------------------------------------------------------- |
| **Bull Strong** | Price above mid EMA, fast EMA above mid EMA, mid EMA above long SMA |
| **Bull Basic** | Price and fast trend are above mid EMA |
| **Neutral** | Mixed |
| **Bear** | Price and averages are bearish |
This row is important because you generally want to buy pullbacks in strong trends, not fight broken charts.
Best setup:
```text
Trend = Bull Strong
```
---
# 12. Stoch
**Stoch** shows Stochastic momentum condition.
Possible values:
| Stoch | Meaning |
| ------------- | ------------------------------------------------------------ |
| **Reset** | Stoch recently got oversold/reset and is turning back up |
| **K>D** | Momentum is positive, but not necessarily from a fresh reset |
| **Roll Over** | Stoch was overbought and crossed down |
| **No Reset** | No useful signal |
Why this matters:
This came from the original HeidingOut-style method:
> Price action leads, Stoch/RSI confirm.
Best entry setup:
```text
Stoch = Reset
```
Caution setup:
```text
Stoch = Roll Over
```
But Stoch is only **2% of AGG** now because oscillators can be noisy.
---
# 13. Price
**Price** is one of the most important rows.
It checks whether price action has actually confirmed.
It requires:
* Higher-low structure
* Close above fast EMA
* Bullish candle
* Close above prior bar high
Possible values:
| Price | Meaning |
| ------------- | -------------------------------------------- |
| **Confirmed** | Price action supports the setup |
| **Waiting** | Setup may exist, but price has not confirmed |
This is weighted **12%** in AGG, which is high.
Why?
Because a setup without price confirmation is still just a possibility.
A BUY TRIGGER requires:
```text
Price = Confirmed
```
---
# 14. INV
**INV** is the invalidation level.
This is the key structural low from the detected impulse/pullback logic.
Plain English:
> If price closes below this level, the setup is probably broken.
Possible values:
| INV | Meaning |
| ----------- | --------------------------------- |
| Price level | Key invalidation reference |
| n/a | Not enough structure detected yet |
Important:
If price breaks below INV, ACTION becomes:
```text
INV
```
Invalidation overrides everything.
Even if RS is strong and CANSLIM is good, a broken structure means the setup has failed.
---
# 15. Target
**Target** shows the projected upside target and upside percentage.
It uses a **1.618 Fib extension** from the detected impulse.
Example:
```text
145.20 / +12.4%
```
Means:
* Potential target: 145.20
* Upside from current price: +12.4%
This is intentionally weighted only **1%** in AGG.
Why so low?
Because targets are estimates. Useful, but not reliable enough to drive the decision.
Use Target as:
> “Is there enough upside to justify the risk?”
Not as:
> “This will definitely go there.”
---
# How the AGG score thinks
The new AGG is intentionally biased toward objective leadership and confirmation.
Current hierarchy:
## Most important
* CANSLIM
* RS
* Price
* Trend
* Pivot
These answer:
> Is this a quality leader acting correctly?
## Middle importance
* 52W
* EWave
* Vol
* MR
These answer:
> Is it near highs, reasonably timed, supported by volume, and not too stretched?
## Lower importance
* Accum
* Stoch
* INV
* Target
These help, but do not dominate.
---
# How to read a good setup
A very good setup would look like:
| Row | Ideal |
| ------- | -------------------------- |
| ACTION | BUY TRIGGER |
| AGG | 80+ |
| EWave | 60+ |
| CANSLIM | 65+ |
| RS | Strong |
| 52W | Better than -15% |
| Vol | 100%+ or 140%+ on breakout |
| Accum | Accum |
| Pivot | Near Pivot or Breakout |
| MR | Normal or Discount |
| Trend | Bull Strong |
| Stoch | Reset or K>D |
| Price | Confirmed |
| INV | Below nearby structure |
| Target | Positive upside |
That is the kind of dashboard that says:
> This is worth real attention.
---
# How to read your ALAB screenshot
From your screenshot, the dashboard looked roughly like:
| Row | Reading |
| ------- | ------------------ |
| ACTION | WAIT |
| EWave | 40 / C Early |
| CANSLIM | 57 / C |
| RS | Strong |
| 52W | -6.1% |
| Vol | 89% |
| Accum | Accum |
| Pivot | Near Pivot |
| MR | Extended 1.73x ATR |
| Trend | Bull Strong |
| Stoch | K>D |
| Price | Waiting |
| Target | n/a |
That says:
**Good stock. Strong RS. Near highs. In a bullish trend. But not confirmed yet, volume is light, and price is a little extended.**
So **WAIT** makes sense.
It is not saying “bad stock.”
It is saying:
> Good candidate, but not a clean entry yet.
---
# The key dashboard philosophy
This is now the right structure:
## CANSLIM finds the leader
Rows:
* CANSLIM
* RS
* 52W
* Vol
* Accum
* Pivot
## EWave helps timing
Rows:
* EWave
* Stoch
* Price
* MR
## Risk/reward controls the trade
Rows:
* INV
* Target
* MR
## AGG combines it all
AGG answers:
> Overall, is this setup strong enough to act on?
---
# My simple decision rules
Use it like this:
## BUY TRIGGER
Only consider buying when:
* ACTION = BUY TRIGGER
* AGG is 80+
* Price is Confirmed
* MR is not Stretched
* INV is clear
* Target gives enough upside
## BUY WATCH
Put on watchlist when:
* ACTION = BUY WATCH
* RS is Strong
* CANSLIM is at least C/B
* Pivot is Near Pivot
* Price is Waiting
## WAIT
Do nothing when:
* Stock is good, but price is not confirmed
* MR is extended
* Volume is not there
* EWave is early
## TRIM / CAUTION
Consider trimming when:
* Stoch rolls over
* MR becomes Stretched
* Price action weakens after a run
## INV
Respect it.
If INV triggers, the setup is broken. Reassess from scratch.
| Row | Purpose |
| ----------- | ---------------------------------------------------- |
| **ACTION** | Final decision output |
| **AGG** | Weighted overall score using all 13 major attributes |
| **EWave** | Elliott/Wolfe/Stoch/RSI-style timing score |
| **CANSLIM** | CANSLIM-style technical quality score |
| **RS** | Relative strength vs QQQ |
| **52W** | Distance from 52-week high |
| **Vol** | Current volume vs average volume |
| **Accum** | Accumulation vs distribution pressure |
| **Pivot** | Whether price is near a breakout/pivot area |
| **MR** | Mean reversion / extension risk |
| **Trend** | Overall trend structure |
| **Stoch** | Momentum reset/exhaustion |
| **Price** | Price action confirmation |
| **INV** | Invalidation level |
| **Target** | Potential upside target |
The color coding is:
| Color | Meaning |
| ------------- | ---------------------------------------------- |
| **Green** | Positive / bullish |
| **Orange** | Watch / caution / constructive but not perfect |
| **Dark gray** | Neutral / waiting |
| **Red** | Negative / risk / failure |
---
# 1. ACTION
This is the **main output**.
Possible values:
| ACTION | Meaning |
| ------------------ | --------------------------------------------------------------------------------- |
| **BUY TRIGGER** | Aggregate score is strong, price confirms, not invalidated, and not too stretched |
| **BUY WATCH** | Setup is building, but not fully confirmed |
| **TRIM / CAUTION** | Momentum may be rolling over or price is stretched |
| **WAIT** | Some positives exist, but not enough for action |
| **NO TRADE** | Weak overall setup |
| **INV** | Invalidation level broke. Setup failed. |
The action row is based mostly on **AGG**, not just EWave.
Current logic:
```text
BUY TRIGGER =
AGG >= 80
AND Price is Confirmed
AND not invalidated
AND MR is not Stretched
```
If you turn on:
```text
Require CANSLIM Filter for BUY TRIGGER
```
Then BUY TRIGGER also requires a minimum CANSLIM-quality pass.
That is the stricter version.
---
# 2. AGG
**AGG** is the most important score now.
It is the weighted aggregate score based on all major dashboard factors. This is the “whole chart quality” score.
Current weighting:
| Attribute | Weight |
| ----------- | -----: |
| **CANSLIM** | 21% |
| **RS** | 13% |
| **Price** | 12% |
| **Trend** | 10% |
| **Pivot** | 10% |
| **52W** | 8% |
| **EWave** | 8% |
| **Vol** | 6% |
| **MR** | 5% |
| **Accum** | 3% |
| **Stoch** | 2% |
| **INV** | 1% |
| **Target** | 1% |
This weighting intentionally makes the dashboard **less wave-heavy**.
The thinking is:
> Great stocks with strong RS and confirmed price action matter more than a possible wave count.
AGG grades:
| AGG Score | Grade | Meaning |
| -----------: | ----- | ---------------------------------- |
| **85+** | A+ | Excellent |
| **80–84** | A | Strong / trigger zone if confirmed |
| **70–79** | B | Good watchlist setup |
| **60–69** | C | Developing but not there yet |
| **50–59** | D | Weak / wait |
| **Under 50** | Weak | No trade |
How I’d use it:
| AGG | Interpretation |
| -----------: | ------------------------------------------------- |
| **80+** | Potential action zone |
| **70–79** | Watch closely |
| **60–69** | Setup forming, still early |
| **Under 60** | Probably ignore unless you have a separate thesis |
---
# 3. EWave
**EWave** is the Elliott/Wolfe-style timing score.
It uses:
| EWave Component | Points |
| --------------------------------------------- | -----: |
| Bullish trend context | 20 |
| Fib pullback / possible Wave 2 or Wave 4 zone | 20 |
| RSI bullish divergence | 20 |
| Stoch reset | 15 |
| Wolfe-like structure | 10 |
| Price action confirmation | 10 |
Maximum is **95**.
Dashboard examples:
| EWave | Meaning |
| ----------------------- | ------------------------ |
| **75+ / A** | Strong wave/timing setup |
| **60–74 / B Watch** | Setup is building |
| **40–59 / C Early** | Early or incomplete |
| **Under 40 / No Trade** | Weak timing setup |
Important: **EWave is only 8% of AGG now.**
That means it helps with timing, but it does not dominate the decision.
Best interpretation:
> EWave tells you whether the pullback/structure/timing looks constructive.
It does **not** mean “this is definitely Wave 3.”
---
# 4. CANSLIM
**CANSLIM** is a technical approximation of CANSLIM-style stock quality.
It does not use IBD’s proprietary EPS, sales, or fund ownership data. TradingView cannot reliably recreate that from Pine.
Instead, it uses technical leadership proxies:
| CANSLIM Component | Points |
| ---------------------------- | -----: |
| RS vs benchmark | 20 |
| RS line near/new high | 15 |
| Distance from 52-week high | 15 |
| Volume vs average | 15 |
| Accumulation vs distribution | 15 |
| Pivot/base status | 20 |
Maximum is **100**.
Grades:
| CANSLIM Score | Grade | Meaning |
| ------------: | ----- | -------------------------------------- |
| **80+** | A | Strong CANSLIM-style technical profile |
| **65–79** | B | Good |
| **50–64** | C | Mixed |
| **Under 50** | Weak | Not acting like a leader |
This is now the **largest weight in AGG** at **21%**.
That’s intentional.
The dashboard is saying:
> Stock quality and leadership come first. Timing comes second.
---
# 5. RS
**RS** means relative strength versus the benchmark, currently defaulted to **QQQ**.
It compares the stock’s performance to QQQ over the selected lookback period.
Possible values:
| RS | Meaning |
| ---------- | ------------------------------------------------------------------------- |
| **Strong** | Stock is outperforming QQQ and its RS line is above its RS moving average |
| **OK** | Stock is outperforming QQQ, but not as strongly |
| **Weak** | Stock is underperforming QQQ |
Why this matters:
CANSLIM-style trading wants **leaders**, not laggards.
A stock with **RS Strong** is showing better demand than the market.
Best read:
| RS | Interpretation |
| ------------------ | ------------------------ |
| **Strong / green** | Good leader behavior |
| **OK / orange** | Acceptable but not elite |
| **Weak / red** | Caution |
---
# 6. 52W
**52W** shows how far the stock is from its 52-week high.
Example:
```text
-6.1%
```
Means the stock is 6.1% below its 52-week high.
Interpretation:
| 52W Distance | Meaning |
| ---------------: | ----------------- |
| **0% to -5%** | Very strong |
| **-5% to -15%** | Good / acceptable |
| **-15% to -25%** | Caution |
| **Below -25%** | Weak / damaged |
Why it matters:
CANSLIM usually prefers stocks near highs, not stocks buried far below highs.
A stock near highs is often showing institutional demand.
---
# 7. Vol
**Vol** shows current volume as a percentage of average volume.
Example:
```text
89%
```
Means current volume is 89% of the average volume.
Interpretation:
| Vol | Meaning |
| -------------- | --------------------------------------- |
| **140%+** | Strong demand / breakout-quality volume |
| **100–139%** | Decent |
| **Under 100%** | Light / not confirmed |
Why it matters:
A breakout or strong move is more convincing when volume expands.
For CANSLIM-style buying, strong volume gives confirmation that bigger buyers may be involved.
One note: on intraday bars or during the trading day, volume can look low until the day completes. On daily charts, interpret it best near/after the close.
---
# 8. Accum
**Accum** tries to detect whether the stock has more accumulation or distribution pressure.
It compares:
* Up days on above-average volume
* Down days on above-average volume
Possible values:
| Accum | Meaning |
| ----------- | ----------------------------------------------------- |
| **Accum** | More heavy-volume up days than heavy-volume down days |
| **Neutral** | No clear edge |
| **Distrib** | More heavy-volume down days than up days |
Why it matters:
CANSLIM cares about institutional accumulation.
A stock can look okay on price, but if it is under distribution, the setup is lower quality.
---
# 9. Pivot
**Pivot** tells you where price is relative to a recent breakout/base area.
It uses the recent high over the base lookback period as a rough pivot reference.
Possible values:
| Pivot | Meaning |
| --------------- | ---------------------------------------------- |
| **Breakout** | Price broke above pivot with strong volume |
| **Near Pivot** | Price is within about 5% below the pivot |
| **Above Pivot** | Price is above pivot, but volume is not strong |
| **Extended** | Price is more than about 5% above pivot |
| **Base Low** | Price is not near a useful pivot area |
Why it matters:
The best setups are often near proper buy areas.
For your dashboard:
| Pivot | Interpretation |
| ----------------------- | ------------------ |
| **Breakout / green** | Strong |
| **Near Pivot / orange** | Watch closely |
| **Extended / red** | Be careful chasing |
| **Base Low / gray** | Not actionable yet |
---
# 10. MR
**MR** means mean reversion / extension risk.
It measures how far price is from the fast EMA using ATR.
Example:
```text
Extended 1.73x ATR
```
Means price is 1.73 ATR above the fast EMA.
Possible values:
| MR | Meaning |
| ------------- | ---------------------------------------------------------- |
| **Discount** | Price pulled back below fast EMA but remains above mid EMA |
| **Normal** | Price is within normal range of fast EMA |
| **Extended** | Price is above normal range |
| **Stretched** | Price is too far extended |
| **Weak** | Price is below mid EMA |
| **n/a** | Not enough data |
Why this matters:
This row helps prevent chasing.
A stock can be strong but too extended for a fresh entry.
Important trigger rule:
```text
BUY TRIGGER cannot fire if MR = Stretched
```
That’s a guardrail.
Best read:
| MR | Interpretation |
| --------------------- | ------------------------ |
| **Discount / green** | Pullback zone |
| **Normal / neutral** | Healthy |
| **Extended / orange** | Be careful |
| **Stretched / red** | Probably not a fresh buy |
| **Weak / red** | Structure may be broken |
---
# 11. Trend
**Trend** gives the broader moving-average structure.
Possible values:
| Trend | Meaning |
| --------------- | ------------------------------------------------------------------- |
| **Bull Strong** | Price above mid EMA, fast EMA above mid EMA, mid EMA above long SMA |
| **Bull Basic** | Price and fast trend are above mid EMA |
| **Neutral** | Mixed |
| **Bear** | Price and averages are bearish |
This row is important because you generally want to buy pullbacks in strong trends, not fight broken charts.
Best setup:
```text
Trend = Bull Strong
```
---
# 12. Stoch
**Stoch** shows Stochastic momentum condition.
Possible values:
| Stoch | Meaning |
| ------------- | ------------------------------------------------------------ |
| **Reset** | Stoch recently got oversold/reset and is turning back up |
| **K>D** | Momentum is positive, but not necessarily from a fresh reset |
| **Roll Over** | Stoch was overbought and crossed down |
| **No Reset** | No useful signal |
Why this matters:
This came from the original HeidingOut-style method:
> Price action leads, Stoch/RSI confirm.
Best entry setup:
```text
Stoch = Reset
```
Caution setup:
```text
Stoch = Roll Over
```
But Stoch is only **2% of AGG** now because oscillators can be noisy.
---
# 13. Price
**Price** is one of the most important rows.
It checks whether price action has actually confirmed.
It requires:
* Higher-low structure
* Close above fast EMA
* Bullish candle
* Close above prior bar high
Possible values:
| Price | Meaning |
| ------------- | -------------------------------------------- |
| **Confirmed** | Price action supports the setup |
| **Waiting** | Setup may exist, but price has not confirmed |
This is weighted **12%** in AGG, which is high.
Why?
Because a setup without price confirmation is still just a possibility.
A BUY TRIGGER requires:
```text
Price = Confirmed
```
---
# 14. INV
**INV** is the invalidation level.
This is the key structural low from the detected impulse/pullback logic.
Plain English:
> If price closes below this level, the setup is probably broken.
Possible values:
| INV | Meaning |
| ----------- | --------------------------------- |
| Price level | Key invalidation reference |
| n/a | Not enough structure detected yet |
Important:
If price breaks below INV, ACTION becomes:
```text
INV
```
Invalidation overrides everything.
Even if RS is strong and CANSLIM is good, a broken structure means the setup has failed.
---
# 15. Target
**Target** shows the projected upside target and upside percentage.
It uses a **1.618 Fib extension** from the detected impulse.
Example:
```text
145.20 / +12.4%
```
Means:
* Potential target: 145.20
* Upside from current price: +12.4%
This is intentionally weighted only **1%** in AGG.
Why so low?
Because targets are estimates. Useful, but not reliable enough to drive the decision.
Use Target as:
> “Is there enough upside to justify the risk?”
Not as:
> “This will definitely go there.”
---
# How the AGG score thinks
The new AGG is intentionally biased toward objective leadership and confirmation.
Current hierarchy:
## Most important
* CANSLIM
* RS
* Price
* Trend
* Pivot
These answer:
> Is this a quality leader acting correctly?
## Middle importance
* 52W
* EWave
* Vol
* MR
These answer:
> Is it near highs, reasonably timed, supported by volume, and not too stretched?
## Lower importance
* Accum
* Stoch
* INV
* Target
These help, but do not dominate.
---
# How to read a good setup
A very good setup would look like:
| Row | Ideal |
| ------- | -------------------------- |
| ACTION | BUY TRIGGER |
| AGG | 80+ |
| EWave | 60+ |
| CANSLIM | 65+ |
| RS | Strong |
| 52W | Better than -15% |
| Vol | 100%+ or 140%+ on breakout |
| Accum | Accum |
| Pivot | Near Pivot or Breakout |
| MR | Normal or Discount |
| Trend | Bull Strong |
| Stoch | Reset or K>D |
| Price | Confirmed |
| INV | Below nearby structure |
| Target | Positive upside |
That is the kind of dashboard that says:
> This is worth real attention.
---
# How to read your ALAB screenshot
From your screenshot, the dashboard looked roughly like:
| Row | Reading |
| ------- | ------------------ |
| ACTION | WAIT |
| EWave | 40 / C Early |
| CANSLIM | 57 / C |
| RS | Strong |
| 52W | -6.1% |
| Vol | 89% |
| Accum | Accum |
| Pivot | Near Pivot |
| MR | Extended 1.73x ATR |
| Trend | Bull Strong |
| Stoch | K>D |
| Price | Waiting |
| Target | n/a |
That says:
**Good stock. Strong RS. Near highs. In a bullish trend. But not confirmed yet, volume is light, and price is a little extended.**
So **WAIT** makes sense.
It is not saying “bad stock.”
It is saying:
> Good candidate, but not a clean entry yet.
---
# The key dashboard philosophy
This is now the right structure:
## CANSLIM finds the leader
Rows:
* CANSLIM
* RS
* 52W
* Vol
* Accum
* Pivot
## EWave helps timing
Rows:
* EWave
* Stoch
* Price
* MR
## Risk/reward controls the trade
Rows:
* INV
* Target
* MR
## AGG combines it all
AGG answers:
> Overall, is this setup strong enough to act on?
---
# My simple decision rules
Use it like this:
## BUY TRIGGER
Only consider buying when:
* ACTION = BUY TRIGGER
* AGG is 80+
* Price is Confirmed
* MR is not Stretched
* INV is clear
* Target gives enough upside
## BUY WATCH
Put on watchlist when:
* ACTION = BUY WATCH
* RS is Strong
* CANSLIM is at least C/B
* Pivot is Near Pivot
* Price is Waiting
## WAIT
Do nothing when:
* Stock is good, but price is not confirmed
* MR is extended
* Volume is not there
* EWave is early
## TRIM / CAUTION
Consider trimming when:
* Stoch rolls over
* MR becomes Stretched
* Price action weakens after a run
## INV
Respect it.
If INV triggers, the setup is broken. Reassess from scratch.
開源腳本
秉持TradingView一貫精神,這個腳本的創作者將其設為開源,以便交易者檢視並驗證其功能。向作者致敬!您可以免費使用此腳本,但請注意,重新發佈代碼需遵守我們的社群規範。

免責聲明
這些資訊和出版物並非旨在提供,也不構成TradingView提供或認可的任何形式的財務、投資、交易或其他類型的建議或推薦。請閱讀使用條款以了解更多資訊。
開源腳本
秉持TradingView一貫精神,這個腳本的創作者將其設為開源,以便交易者檢視並驗證其功能。向作者致敬!您可以免費使用此腳本,但請注意,重新發佈代碼需遵守我們的社群規範。
免責聲明
這些資訊和出版物並非旨在提供,也不構成TradingView提供或認可的任何形式的財務、投資、交易或其他類型的建議或推薦。請閱讀使用條款以了解更多資訊。