Sage Wave (RichPole)
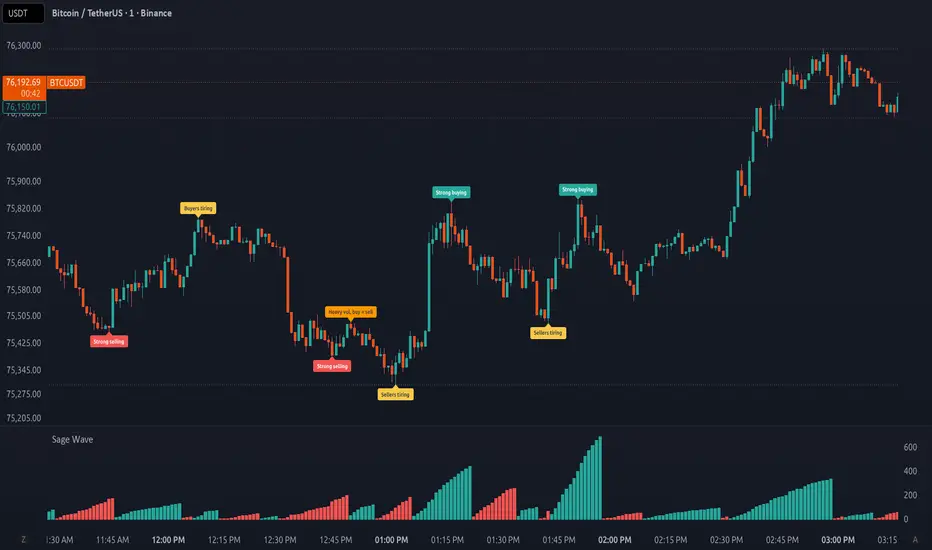
Sage Wave adds up the volume inside each price wave and shows the total as columns below the chart. When a wave ends, a short note on the price chart says what kind of wave it was, so you can compare effort (volume) with result (price movement) at a glance.
HOW IT WORKS
- Waves: closing prices are lightly smoothed (EMA, length 2). A wave turns when price moves back by the reversal size (default 1.0 x ATR 14, with an optional minimum in percent, ticks or price units) and the move holds for 2 closed candles. A wave needs at least 2 bars.
- Columns: all volume inside the wave is summed. Green = up wave, red = down wave. The open wave grows live while a candle forms; a wave only turns on a closed candle, and finished waves are never redrawn.
- Notes: each finished wave is compared with the average of the last 10 finished waves.
Strong buying / Strong selling = wave volume at least 2x the average.
Buyers tiring / Sellers tiring = price made a new high (or low) but the wave had less volume than the previous wave on the same side.
Heavy vol, buy = sell = at least average volume, but the price move was less than half of the average wave move (effort without result).
Light buying / Light selling = volume under half the average (shown only when "All waves" is selected).
- By default only the key notes are shown (Strong, Tiring, Heavy). Hover a note to read why it was printed.
WHAT IS ORIGINAL
Wave volume is a well-known idea (Richard Wyckoff, later David Weis). This script is written from scratch: an ATR-based, closed-candle wave engine that never redraws finished waves, plus a classifier that compares every finished wave with recent waves and prints a plain-English note (strong, tiring, heavy volume with little movement, light) with a tooltip explaining the reason.
HOW TO USE IT
Treat the notes as context, not as buy or sell signals. A simple checklist:
1. Where: price is at a level that matters (a pivot, Camarilla R3/S3, an obvious old high or low).
2. Who: a Sage Wave note appears there (for example Buyers tiring or Heavy vol, buy = sell).
3. When: market structure breaks in the new direction.
If one of the three is missing, skip the trade. In trends, Strong waves followed by pullbacks on small columns describe a healthy trend.
SETTINGS
Reversal size, minimum reversal, smoothing, confirmation bars, minimum wave bars, which notes to show, note text, note thresholds, note position (price chart or volume pane), colours, optional candle colouring.
Alerts (on candle close): new up wave, new down wave, tiring wave, heavy volume, strong wave.
LIMITATIONS
- It needs volume. Many index symbols have none; the script then shows a warning. On forex, volume is tick volume (activity, not traded size).
- Readings are relative: "heavy" means heavy compared with nearby waves on the same settings. A different reversal size gives different waves.
- In our own tests on gold and EURUSD, the tiring note alone did not show a reliable edge. Use it together with levels and structure.
- Educational tool. It does not place trades and is not financial advice.
HOW IT WORKS
- Waves: closing prices are lightly smoothed (EMA, length 2). A wave turns when price moves back by the reversal size (default 1.0 x ATR 14, with an optional minimum in percent, ticks or price units) and the move holds for 2 closed candles. A wave needs at least 2 bars.
- Columns: all volume inside the wave is summed. Green = up wave, red = down wave. The open wave grows live while a candle forms; a wave only turns on a closed candle, and finished waves are never redrawn.
- Notes: each finished wave is compared with the average of the last 10 finished waves.
Strong buying / Strong selling = wave volume at least 2x the average.
Buyers tiring / Sellers tiring = price made a new high (or low) but the wave had less volume than the previous wave on the same side.
Heavy vol, buy = sell = at least average volume, but the price move was less than half of the average wave move (effort without result).
Light buying / Light selling = volume under half the average (shown only when "All waves" is selected).
- By default only the key notes are shown (Strong, Tiring, Heavy). Hover a note to read why it was printed.
WHAT IS ORIGINAL
Wave volume is a well-known idea (Richard Wyckoff, later David Weis). This script is written from scratch: an ATR-based, closed-candle wave engine that never redraws finished waves, plus a classifier that compares every finished wave with recent waves and prints a plain-English note (strong, tiring, heavy volume with little movement, light) with a tooltip explaining the reason.
HOW TO USE IT
Treat the notes as context, not as buy or sell signals. A simple checklist:
1. Where: price is at a level that matters (a pivot, Camarilla R3/S3, an obvious old high or low).
2. Who: a Sage Wave note appears there (for example Buyers tiring or Heavy vol, buy = sell).
3. When: market structure breaks in the new direction.
If one of the three is missing, skip the trade. In trends, Strong waves followed by pullbacks on small columns describe a healthy trend.
SETTINGS
Reversal size, minimum reversal, smoothing, confirmation bars, minimum wave bars, which notes to show, note text, note thresholds, note position (price chart or volume pane), colours, optional candle colouring.
Alerts (on candle close): new up wave, new down wave, tiring wave, heavy volume, strong wave.
LIMITATIONS
- It needs volume. Many index symbols have none; the script then shows a warning. On forex, volume is tick volume (activity, not traded size).
- Readings are relative: "heavy" means heavy compared with nearby waves on the same settings. A different reversal size gives different waves.
- In our own tests on gold and EURUSD, the tiring note alone did not show a reliable edge. Use it together with levels and structure.
- Educational tool. It does not place trades and is not financial advice.

免責聲明
這些資訊和出版物並非旨在提供,也不構成TradingView提供或認可的任何形式的財務、投資、交易或其他類型的建議或推薦。請閱讀使用條款以了解更多資訊。