OPEN-SOURCE SCRIPT
Volume Aggregation Bars [TradingIQ]
Hello Traders!
🔹Volume Aggregation Bars
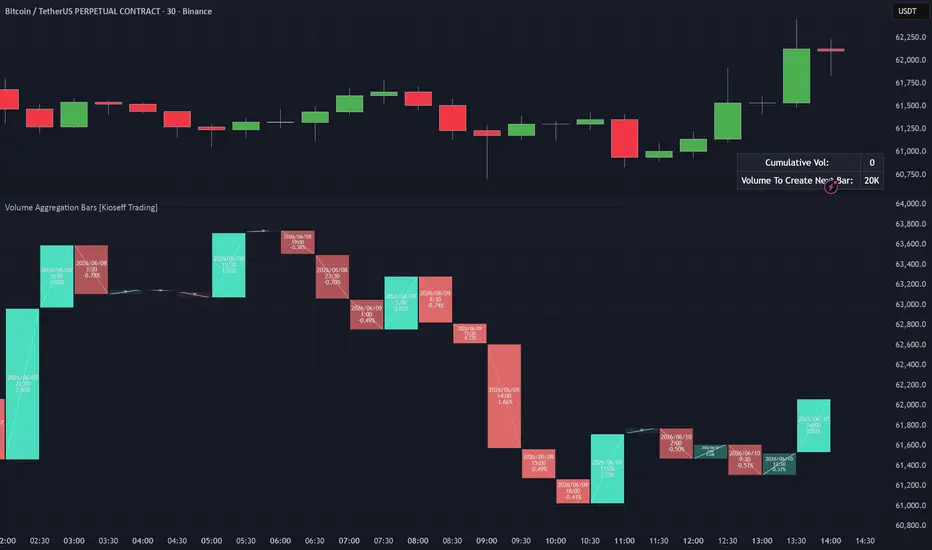
Volume Aggregation Bars is a volume-based candle visualization tool designed to show how price moves after a fixed amount of trading activity has occurred.
Instead of building candles from fixed time intervals, this tool builds candles from fixed volume thresholds.
That means each displayed bar represents a comparable amount of participation, helping traders study price movement through the lens of activity, effort, efficiency, and participation-based structure.
🔹What the tool shows
🔸Volume-based candles
Traditional candles are built from time.
For example, a 5-minute candle closes every 5 minutes whether the market was active or quiet.
Volume Aggregation Bars work differently.
A new candle is created only after the selected amount of volume has traded.
This helps normalize each candle around market participation rather than time.
In simple terms:
🔸Auto or custom volume thresholds
The script can automatically estimate a useful volume threshold, or traders can manually define their own required volume amount.
You can choose between:
Auto mode uses recent volume behavior to create a dynamic aggregation threshold.
Required Volume mode lets you choose the exact volume needed to form each new candle.
This gives flexibility for traders who want either an adaptive setting or a fixed, repeatable volume model.
🔸Dollar-volume mode
The tool can also treat the required volume setting as a dollar amount.
When enabled, the script converts traded volume into dollar-volume when appropriate.
This is useful because raw volume can vary heavily between assets.
Dollar-volume can help normalize activity across different markets by focusing on the value traded rather than only the number of units traded.
🔸Lower-timeframe volume aggregation
Volume Aggregation Bars can use lower-timeframe data to build more accurate volume candles.
Instead of relying only on the chart timeframe, the script can request lower-timeframe volume and price data to better track when the volume threshold is reached.
This helps improve the accuracy of each volume-based candle, especially on higher chart timeframes.
🔸Directional candle coloring
Each completed volume candle is colored based on whether price closed above or below the prior completed volume candle.
This makes it easy to see whether each block of market participation resulted in upward or downward price movement.
🔸Efficiency-based transparency
The script also adjusts candle transparency based on movement efficiency.
Efficiency compares how much price moved from the previous close relative to the total high-low range of that volume block.
A cleaner directional move will appear stronger.
A choppier or less efficient move will appear more faded.
This helps separate:
🔸Developing current candle
The current unfinished volume candle is displayed separately while it is still forming.
The script shows the current progress toward the next completed volume bar.
This lets traders see how close the market is to completing the next volume aggregation candle.
The developing candle can help answer:
🔸Volume progress table
The built-in table shows real-time volume progress information.
Depending on your settings, it can display:
This gives a quick reference for how close the current candle is to completion.
🔹How to read it
Each component gives a different layer of market context:
Volume candle → price movement after a fixed amount of activity
Green candle → price moved higher after the volume block completed
Red candle → price moved lower after the volume block completed
Wick → high and low reached during the volume block
Transparency → directional efficiency of the move
Current candle → unfinished volume block in progress
Volume table → remaining activity needed before the next bar forms
🔹Why this tool is useful
It gives you:
🔹Best use cases
🔹Important note
This tool is based on historical volume and price movement.
That means:
🔹Inputs you can customize
The script includes flexible controls such as:
Closing Notes
Volume Aggregation Bars is built to shift the focus from asking what did price do after a fixed amount of time to asking what did price do after a fixed amount of market activity.
It helps traders visualize price movement through participation, volume efficiency, and activity-based structure.
Thank you for checking it out!
🔹Volume Aggregation Bars
Volume Aggregation Bars is a volume-based candle visualization tool designed to show how price moves after a fixed amount of trading activity has occurred.
Instead of building candles from fixed time intervals, this tool builds candles from fixed volume thresholds.
That means each displayed bar represents a comparable amount of participation, helping traders study price movement through the lens of activity, effort, efficiency, and participation-based structure.
- builds candles from volume instead of time
- supports automatic or custom volume thresholds
- optional dollar-volume aggregation
- uses lower-timeframe volume data for improved accuracy
- shows developing volume-bar progress in real time
- displays directional candles with optional wicks
- includes a volume progress table
🔹What the tool shows
🔸Volume-based candles
Traditional candles are built from time.
For example, a 5-minute candle closes every 5 minutes whether the market was active or quiet.
Volume Aggregation Bars work differently.
A new candle is created only after the selected amount of volume has traded.
This helps normalize each candle around market participation rather than time.
In simple terms:
- high activity creates new candles faster
- low activity creates new candles slower
- each candle reflects a more comparable amount of traded volume
- price movement can be studied relative to actual participation
🔸Auto or custom volume thresholds
The script can automatically estimate a useful volume threshold, or traders can manually define their own required volume amount.
You can choose between:
- Auto
- Required Volume
Auto mode uses recent volume behavior to create a dynamic aggregation threshold.
Required Volume mode lets you choose the exact volume needed to form each new candle.
This gives flexibility for traders who want either an adaptive setting or a fixed, repeatable volume model.
🔸Dollar-volume mode
The tool can also treat the required volume setting as a dollar amount.
When enabled, the script converts traded volume into dollar-volume when appropriate.
This is useful because raw volume can vary heavily between assets.
Dollar-volume can help normalize activity across different markets by focusing on the value traded rather than only the number of units traded.
🔸Lower-timeframe volume aggregation
Volume Aggregation Bars can use lower-timeframe data to build more accurate volume candles.
Instead of relying only on the chart timeframe, the script can request lower-timeframe volume and price data to better track when the volume threshold is reached.
This helps improve the accuracy of each volume-based candle, especially on higher chart timeframes.
🔸Directional candle coloring
Each completed volume candle is colored based on whether price closed above or below the prior completed volume candle.
This makes it easy to see whether each block of market participation resulted in upward or downward price movement.
- green candles show upward movement
- red candles show downward movement
- optional wicks can display the high and low within each volume block
🔸Efficiency-based transparency
The script also adjusts candle transparency based on movement efficiency.
Efficiency compares how much price moved from the previous close relative to the total high-low range of that volume block.
A cleaner directional move will appear stronger.
A choppier or less efficient move will appear more faded.
This helps separate:
- clean directional movement
- choppy movement
- weak movement inside a wider range
- high-volume activity with limited directional progress
🔸Developing current candle
The current unfinished volume candle is displayed separately while it is still forming.
The script shows the current progress toward the next completed volume bar.
This lets traders see how close the market is to completing the next volume aggregation candle.
The developing candle can help answer:
- how much volume has already accumulated
- how much volume remains before the next bar forms
- whether the current volume block is moving price meaningfully
- whether activity is speeding up or slowing down
🔸Volume progress table
The built-in table shows real-time volume progress information.
Depending on your settings, it can display:
- current cumulative volume
- volume required to create the next bar
- remaining volume before the next aggregation candle completes
This gives a quick reference for how close the current candle is to completion.
🔹How to read it
Each component gives a different layer of market context:
Volume candle → price movement after a fixed amount of activity
Green candle → price moved higher after the volume block completed
Red candle → price moved lower after the volume block completed
Wick → high and low reached during the volume block
Transparency → directional efficiency of the move
Current candle → unfinished volume block in progress
Volume table → remaining activity needed before the next bar forms
🔹Why this tool is useful
It gives you:
- a cleaner way to study price movement by participation
- an alternative to fixed-time candles
- a way to see whether volume is producing meaningful movement
- better context during high-volume and low-volume conditions
- a visual map of activity-based price movement
- a framework for comparing effort versus result
🔹Best use cases
- studying price movement after fixed volume thresholds
- analyzing high-volume market activity
- identifying efficient directional moves
- comparing active and inactive market periods
- observing how price reacts as participation builds
- filtering out some of the distortion created by fixed-time candles
- building context around effort versus result
🔹Important note
This tool is based on historical volume and price movement.
That means:
- volume bars do not predict future price direction
- strong volume does not guarantee continuation
- low efficiency does not automatically mean reversal
- high efficiency does not automatically mean trend strength will continue
- volume aggregation should be used as context, not certainty
🔹Inputs you can customize
The script includes flexible controls such as:
- lower-timeframe volume source
- automatic volume aggregation mode
- custom required volume threshold
- optional dollar-volume setting
- wick display
- number of volume blocks shown
- time label display options
- time label size
- candle border width
- volume progress table
- table position
Closing Notes
Volume Aggregation Bars is built to shift the focus from asking what did price do after a fixed amount of time to asking what did price do after a fixed amount of market activity.
It helps traders visualize price movement through participation, volume efficiency, and activity-based structure.
Thank you for checking it out!
開源腳本
秉持TradingView一貫精神,這個腳本的創作者將其設為開源,以便交易者檢視並驗證其功能。向作者致敬!您可以免費使用此腳本,但請注意,重新發佈代碼需遵守我們的社群規範。

Get Access To Our Tools: tradingiq.io
Subscribe For Daily Content: youtube.com/watch?v=Gx_cW29BUds
Subscribe For Daily Content: youtube.com/watch?v=Gx_cW29BUds
免責聲明
這些資訊和出版物並非旨在提供,也不構成TradingView提供或認可的任何形式的財務、投資、交易或其他類型的建議或推薦。請閱讀使用條款以了解更多資訊。
開源腳本
秉持TradingView一貫精神,這個腳本的創作者將其設為開源,以便交易者檢視並驗證其功能。向作者致敬!您可以免費使用此腳本,但請注意,重新發佈代碼需遵守我們的社群規範。
Get Access To Our Tools: tradingiq.io
Subscribe For Daily Content: youtube.com/watch?v=Gx_cW29BUds
Subscribe For Daily Content: youtube.com/watch?v=Gx_cW29BUds
免責聲明
這些資訊和出版物並非旨在提供,也不構成TradingView提供或認可的任何形式的財務、投資、交易或其他類型的建議或推薦。請閱讀使用條款以了解更多資訊。