OPEN-SOURCE SCRIPT
QuantumPips Flow Bias
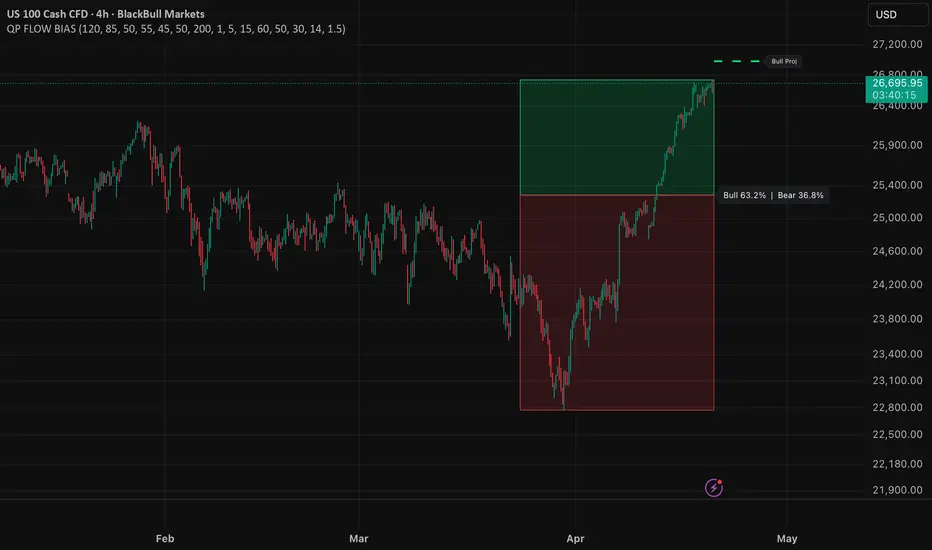
QuantumPips Flow Bias (EMA + Volume Delta)
QuantumPips Flow Bias is a visual market-bias tool that combines trend direction (EMA) with a simple volume-pressure proxy to help you read whether buyers or sellers have had more control over the most recent price action.
This indicator is not a signal generator by default, it’s designed to give you context and confirmation so you can align entries with stronger market conditions.
1) What you see on the chart
Bull/Bear Flow Box
A large box is drawn using the last Lookback bars:
This percentage is calculated using a volume delta proxy:
It’s a proxy, not true exchange order flow, but it’s useful for quickly spotting whether volume has mostly supported buying or selling inside the lookback window.
2) Trend Confirmation (EMA)
The indicator checks the trend using two EMAs:
When fast EMA is above slow EMA → trend bias is bullish
When fast EMA is below slow EMA → trend bias is bearish
Optional: Require EMA Fast slope
If ON, the fast EMA must also be rising (bull) or falling (bear). This filters chop but may reduce early bias flips.
3) Volume Delta Confirm (Proxy)
A second “pressure check” runs on a shorter window: Delta window (bars).
Defaults:
Bull confirm if Bull% > 55%
Bear confirm if Bull% < 45%
4) Bias logic (how “Bullish/Bearish/Neutral” is decided)
The indicator only shows a strong bias when both conditions agree:
✅ Bullish = (EMA trend bullish) AND (flow bullish)
✅ Bearish = (EMA trend bearish) AND (flow bearish)
Otherwise → Neutral (mixed or choppy conditions)
5) Projection line (dashed)
The dashed line is a simple forward “roadmap” based on:
This projection is best used as a reference area, not a target guarantee. It’s meant to help you visualize where price could reach if the bias continues.
QuantumPips Flow Bias is a visual market-bias tool that combines trend direction (EMA) with a simple volume-pressure proxy to help you read whether buyers or sellers have had more control over the most recent price action.
This indicator is not a signal generator by default, it’s designed to give you context and confirmation so you can align entries with stronger market conditions.
1) What you see on the chart
Bull/Bear Flow Box
A large box is drawn using the last Lookback bars:
- Green area = bullish pressure
- Red area = bearish pressure
- The label shows the split as:
- Bull X% | Bear Y%
This percentage is calculated using a volume delta proxy:
- If a candle closes up, its volume is treated as “bull volume”
- If a candle closes down, its volume is treated as “bear volume”
- Doji candles split volume 50/50
It’s a proxy, not true exchange order flow, but it’s useful for quickly spotting whether volume has mostly supported buying or selling inside the lookback window.
2) Trend Confirmation (EMA)
The indicator checks the trend using two EMAs:
- EMA Fast (default 50)
- EMA Slow (default 200)
When fast EMA is above slow EMA → trend bias is bullish
When fast EMA is below slow EMA → trend bias is bearish
Optional: Require EMA Fast slope
If ON, the fast EMA must also be rising (bull) or falling (bear). This filters chop but may reduce early bias flips.
3) Volume Delta Confirm (Proxy)
A second “pressure check” runs on a shorter window: Delta window (bars).
- If Bull% is above Bull threshold → bull flow confirmation
- If Bull% is below Bear threshold → bear flow confirmation
Defaults:
Bull confirm if Bull% > 55%
Bear confirm if Bull% < 45%
4) Bias logic (how “Bullish/Bearish/Neutral” is decided)
The indicator only shows a strong bias when both conditions agree:
✅ Bullish = (EMA trend bullish) AND (flow bullish)
✅ Bearish = (EMA trend bearish) AND (flow bearish)
Otherwise → Neutral (mixed or choppy conditions)
5) Projection line (dashed)
The dashed line is a simple forward “roadmap” based on:
- ATR distance × multiplier
- Optionally scaled by flow strength
This projection is best used as a reference area, not a target guarantee. It’s meant to help you visualize where price could reach if the bias continues.
開源腳本
秉持TradingView一貫精神,這個腳本的創作者將其設為開源,以便交易者檢視並驗證其功能。向作者致敬!您可以免費使用此腳本,但請注意,重新發佈代碼需遵守我們的社群規範。

QuantumPips — Trade Structure. Not Noise.
Market Structure Pro (Invite-only): quantumpips.io/msp
Educational only. Not financial advice.
Market Structure Pro (Invite-only): quantumpips.io/msp
Educational only. Not financial advice.
免責聲明
這些資訊和出版物並非旨在提供,也不構成TradingView提供或認可的任何形式的財務、投資、交易或其他類型的建議或推薦。請閱讀使用條款以了解更多資訊。
開源腳本
秉持TradingView一貫精神,這個腳本的創作者將其設為開源,以便交易者檢視並驗證其功能。向作者致敬!您可以免費使用此腳本,但請注意,重新發佈代碼需遵守我們的社群規範。
QuantumPips — Trade Structure. Not Noise.
Market Structure Pro (Invite-only): quantumpips.io/msp
Educational only. Not financial advice.
Market Structure Pro (Invite-only): quantumpips.io/msp
Educational only. Not financial advice.
免責聲明
這些資訊和出版物並非旨在提供,也不構成TradingView提供或認可的任何形式的財務、投資、交易或其他類型的建議或推薦。請閱讀使用條款以了解更多資訊。