OPEN-SOURCE SCRIPT
Buy/Sell Signal (KenshinC)
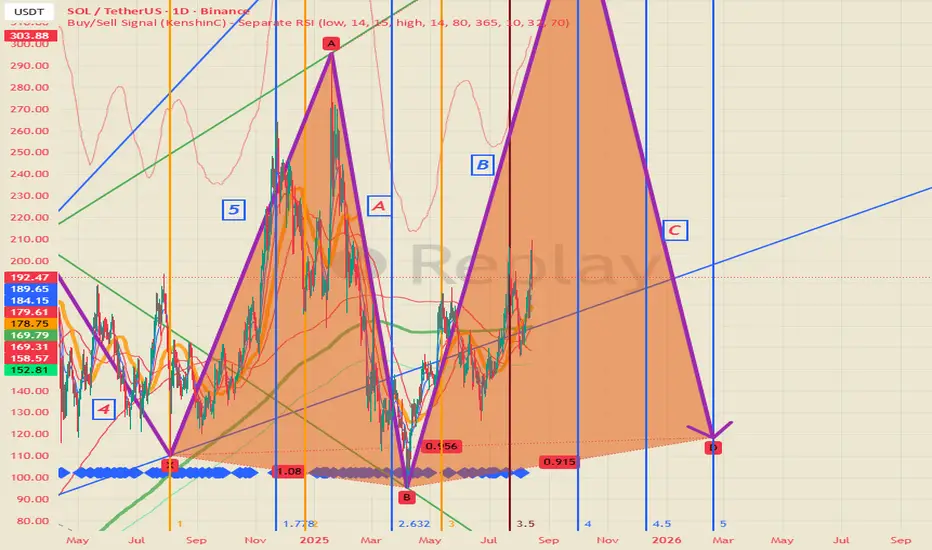
### Buy/Sell Signal (KenshinC)
This custom indicator helps traders identify potential BUY and SELL opportunities by combining:
- Two independent RSI calculations (one from Low, one from High)
- 3-bar price action patterns
- Long-term and short-term Moving Average trend filters
---
### KEY FEATURES
- Dual Separate RSI System (Buy RSI on Low + Sell RSI on High)
- 3 Consecutive Bars Momentum Confirmation
- Dynamic MA Threshold Filters
- Clean visual plots (EMA 5/10/20, SMA 50/200, Long & Short MA)
- Real-time Information Table
- Built-in Alert Conditions
---
### HOW TO USE
**1. Adding the Indicator**
1. Open your chart on TradingView
2. Click "Indicators" → Search "Buy/Sell Signal (KenshinC)"
3. Add to chart
**2. Main Settings**
**RSI Buy Settings**
- RSI Buy Source: Low (default)
- RSI Buy Length: 14
- RSI Buy Level: 15.0 (Buy when below this)
**RSI Sell Settings**
- RSI Sell Source: High (default)
- RSI Sell Length: 14
- RSI Sell Level: 80.0 (Sell when above this)
**Trend Filter**
- MA Long-term (Buy Filter): 365 periods
- % Below MA Long-term for Buy: 10%
- MA Short-term (Sell Filter): 32 periods
- % Above MA Short-term for Sell: 70%
**Display Settings**
- Show Table: On/Off
- Table Position: Top Right, Top Left, etc.
---
### SIGNAL CONDITIONS
**BUY Signal** (Large Green Triangle)
All conditions must be true:
- 3 consecutive down bars
- RSI Buy < Buy Level
- Price < Long-term MA by at least X%
- Price < Short-term MA
**SELL Signal** (Large Red Triangle)
All conditions must be true:
- 3 consecutive up bars
- RSI Sell > Sell Level
- Price > Short-term MA by at least X%
- Price > Long-term MA
---
### RECOMMENDED USAGE
- Best performance on higher timeframes (1H, 4H, Daily, Weekly)
- Use together with support/resistance and volume
- Always wait for candle close before entering
- Enable alerts for real-time notification
- Monitor the information table to check signal readiness
---
### IMPORTANT DISCLAIMER
**This indicator is for educational and entertainment purposes only.**
It is **NOT** financial advice, investment recommendation, or trading advice.
Past performance does not guarantee future results.
Trading carries a high level of risk and you may lose all your capital.
Always conduct your own research and consult a professional financial advisor before making any trading decisions.
---
**Created by KenshinC**
This custom indicator helps traders identify potential BUY and SELL opportunities by combining:
- Two independent RSI calculations (one from Low, one from High)
- 3-bar price action patterns
- Long-term and short-term Moving Average trend filters
---
### KEY FEATURES
- Dual Separate RSI System (Buy RSI on Low + Sell RSI on High)
- 3 Consecutive Bars Momentum Confirmation
- Dynamic MA Threshold Filters
- Clean visual plots (EMA 5/10/20, SMA 50/200, Long & Short MA)
- Real-time Information Table
- Built-in Alert Conditions
---
### HOW TO USE
**1. Adding the Indicator**
1. Open your chart on TradingView
2. Click "Indicators" → Search "Buy/Sell Signal (KenshinC)"
3. Add to chart
**2. Main Settings**
**RSI Buy Settings**
- RSI Buy Source: Low (default)
- RSI Buy Length: 14
- RSI Buy Level: 15.0 (Buy when below this)
**RSI Sell Settings**
- RSI Sell Source: High (default)
- RSI Sell Length: 14
- RSI Sell Level: 80.0 (Sell when above this)
**Trend Filter**
- MA Long-term (Buy Filter): 365 periods
- % Below MA Long-term for Buy: 10%
- MA Short-term (Sell Filter): 32 periods
- % Above MA Short-term for Sell: 70%
**Display Settings**
- Show Table: On/Off
- Table Position: Top Right, Top Left, etc.
---
### SIGNAL CONDITIONS
**BUY Signal** (Large Green Triangle)
All conditions must be true:
- 3 consecutive down bars
- RSI Buy < Buy Level
- Price < Long-term MA by at least X%
- Price < Short-term MA
**SELL Signal** (Large Red Triangle)
All conditions must be true:
- 3 consecutive up bars
- RSI Sell > Sell Level
- Price > Short-term MA by at least X%
- Price > Long-term MA
---
### RECOMMENDED USAGE
- Best performance on higher timeframes (1H, 4H, Daily, Weekly)
- Use together with support/resistance and volume
- Always wait for candle close before entering
- Enable alerts for real-time notification
- Monitor the information table to check signal readiness
---
### IMPORTANT DISCLAIMER
**This indicator is for educational and entertainment purposes only.**
It is **NOT** financial advice, investment recommendation, or trading advice.
Past performance does not guarantee future results.
Trading carries a high level of risk and you may lose all your capital.
Always conduct your own research and consult a professional financial advisor before making any trading decisions.
---
**Created by KenshinC**
開源腳本
秉持TradingView一貫精神,這個腳本的創作者將其設為開源,以便交易者檢視並驗證其功能。向作者致敬!您可以免費使用此腳本,但請注意,重新發佈代碼需遵守我們的社群規範。

Made with passion by KenshinC
免責聲明
這些資訊和出版物並非旨在提供,也不構成TradingView提供或認可的任何形式的財務、投資、交易或其他類型的建議或推薦。請閱讀使用條款以了解更多資訊。
開源腳本
秉持TradingView一貫精神,這個腳本的創作者將其設為開源,以便交易者檢視並驗證其功能。向作者致敬!您可以免費使用此腳本,但請注意,重新發佈代碼需遵守我們的社群規範。
Made with passion by KenshinC
免責聲明
這些資訊和出版物並非旨在提供,也不構成TradingView提供或認可的任何形式的財務、投資、交易或其他類型的建議或推薦。請閱讀使用條款以了解更多資訊。