已更新
Titpaud SMC All TFs
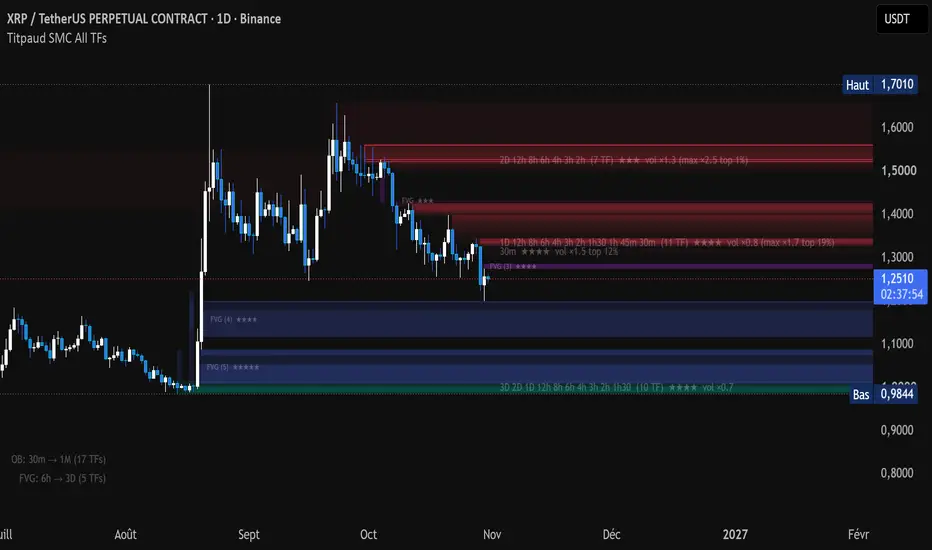
OVERVIEW
Titpaud SMC All TFs draws the order blocks (OBs) and fair value gaps (FVGs) of many timeframes at once on a single chart. Instead of switching timeframes to find higher-timeframe zones, you see every zone from 1 minute up to 1 month (or 3 months) together, and the script highlights where zones of several timeframes overlap. The goal is to read multi-timeframe confluence of supply and demand zones at a glance.
CREDITS AND LICENCE
The market structure, order block and fair value gap engine of this script is taken from the open-source script "Price Action Smart Money Concepts [BigBeluga]" by BigBeluga. The FVG size criterion (gap size compared with the largest gap of the last 1000 candles) and the idea of rating FVGs by their buy / sell volume come from the open-source script "Volumatic Fair Value Gaps [BigBeluga]", also by BigBeluga. Full credit to BigBeluga for that work. Both are reused under their licence (Creative Commons Attribution-NonCommercial-ShareAlike 4.0), and this script is published open source under the same licence.
WHAT IS NEW COMPARED WITH THE ORIGINALS
The original scripts work on the chart timeframe only. This script adds:
1. A timeframe grid. The structure, OB and FVG engine runs separately inside each timeframe of a list (22 timeframes from 1m to 1M, 36 timeframes from 1m to 3M, or a custom list of 16), through one request per timeframe that returns both its OBs and its FVGs. Each timeframe can be included or excluded with a range relative to the chart timeframe (for example from chart / 64 to chart x 1000 for OBs, chart / 4 to chart x 4 for FVGs).
2. Confluence detection. Overlapping OBs of the same direction from different timeframes are grouped. By default only OBs that overlap OBs of at least 2 other timeframes are kept, plus the most recent OB and the chart-timeframe OBs. Each group gets one label, placed on the band where the most OBs of the group overlap, listing its timeframes, how many there are, the best star rating and the heaviest volume.
3. Nested OBs. An OB lying inside an OB of a higher timeframe is marked with a diamond and a stronger border.
4. OB strength rating, from 1 to 5 stars, one star per criterion met:
V - the OB candle volume is at least 1.5 times its 20-period average
I - the impulse from the OB to the structure break is at least 3 ATR(14)
R - the best bounce after a retest of the zone is at least 2 ATR(14)
F - the impulse leaving the OB left a fair value gap
S - the OB swept liquidity: its candle went beyond the last confirmed swing low (bullish OB) or swing high (bearish OB), then a close came back within a set number of candles
More stars make the box less transparent. All thresholds are adjustable.
5. OB volume weight. Each OB volume is compared with the average of the last 50 OBs of the same timeframe and direction. Heavy OBs get a solid border, and the group label shows the multiple and rank of the heaviest one (for example "vol x2.4 top 3%").
6. FVG strength rating (optional, off by default), from 1 to 5 stars, measured in the FVG's own timeframe:
V - the volume of the middle candle is at least 1.5 times its 20-candle average
D - at least 65 percent of the middle candle volume goes in the FVG direction (estimated from where the candle closed within its range)
T - the gap is at least 10 percent of the largest gap of the last 1000 candles
O - the FVG touches a same-direction OB
I - the FVG is still mostly intact (filled less than 50 percent)
More stars make the FVG less transparent, the stars can be written at the start of each FVG, and FVGs below a chosen number of stars can be hidden.
7. End of zones. A zone ends at the first chart-timeframe close through it: the box either stops at the break or is hidden.
8. FVG options: minimum size in ATR, strong middle candle, only the unfilled part, only the nearest FVGs, only FVGs touching an OB, outline with a 50 percent line, short boxes, and separate colours (blue and violet by default) so FVGs are not confused with OBs. FVGs of several timeframes that overlap become more visible.
HOW TO USE IT
- Add it to any chart. The default "Wide" list covers 1m to 1M. The legend in the bottom-left corner shows which timeframes are computed for OBs and for FVGs.
- Darker areas are where boxes of several timeframes stack up. The labels tell you which timeframes are involved, the best star rating in the group and the heaviest volume.
- Bullish OBs are green and bearish OBs are red. The border style can be set per timeframe class, from lower to higher timeframes.
- If the chart is too busy, lower the number of OBs per side, narrow the timeframe range, raise the minimum number of overlapping timeframes, set a maximum distance from price, or hide the FVGs below a number of stars.
- To see only the FVGs, untick "Show order blocks".
HOW IT AVOIDS REPAINTING
Every timeframe is requested without lookahead, and each one only returns zones from its last closed candle. A higher-timeframe zone therefore appears only after that higher-timeframe candle has closed and does not change afterwards.
Note that an OB box starts at the time of the OB candle, which is in the past: the zone is only known once the later structure break confirms it, and it is then drawn back from its origin candle. This is how order blocks work in general, not a lookahead.
LIMITS
- TradingView allows 40 requests per script and 500 boxes per script. With the 36-timeframe list the script is heavy: lower the history per timeframe if it is slow. When the box limit is reached, a warning appears in the legend and some zones are not drawn.
- Lower timeframes only go back as far as their history setting allows (for example 1500 one-minute candles is about 25 hours), so older low-timeframe zones are not found.
- The buy / sell split of the FVG rating is an estimate from a single candle, not real order flow.
- Results depend on the volume data of the symbol. On symbols without volume, the volume criteria and the volume weight are not meaningful.
- This is a visual tool to read price structure. It does not give buy or sell signals, makes no claim about win rate, and past zones do not guarantee future reactions.
SETTINGS LANGUAGE
All settings, tooltips and labels are in English.
Titpaud SMC All TFs draws the order blocks (OBs) and fair value gaps (FVGs) of many timeframes at once on a single chart. Instead of switching timeframes to find higher-timeframe zones, you see every zone from 1 minute up to 1 month (or 3 months) together, and the script highlights where zones of several timeframes overlap. The goal is to read multi-timeframe confluence of supply and demand zones at a glance.
CREDITS AND LICENCE
The market structure, order block and fair value gap engine of this script is taken from the open-source script "Price Action Smart Money Concepts [BigBeluga]" by BigBeluga. The FVG size criterion (gap size compared with the largest gap of the last 1000 candles) and the idea of rating FVGs by their buy / sell volume come from the open-source script "Volumatic Fair Value Gaps [BigBeluga]", also by BigBeluga. Full credit to BigBeluga for that work. Both are reused under their licence (Creative Commons Attribution-NonCommercial-ShareAlike 4.0), and this script is published open source under the same licence.
WHAT IS NEW COMPARED WITH THE ORIGINALS
The original scripts work on the chart timeframe only. This script adds:
1. A timeframe grid. The structure, OB and FVG engine runs separately inside each timeframe of a list (22 timeframes from 1m to 1M, 36 timeframes from 1m to 3M, or a custom list of 16), through one request per timeframe that returns both its OBs and its FVGs. Each timeframe can be included or excluded with a range relative to the chart timeframe (for example from chart / 64 to chart x 1000 for OBs, chart / 4 to chart x 4 for FVGs).
2. Confluence detection. Overlapping OBs of the same direction from different timeframes are grouped. By default only OBs that overlap OBs of at least 2 other timeframes are kept, plus the most recent OB and the chart-timeframe OBs. Each group gets one label, placed on the band where the most OBs of the group overlap, listing its timeframes, how many there are, the best star rating and the heaviest volume.
3. Nested OBs. An OB lying inside an OB of a higher timeframe is marked with a diamond and a stronger border.
4. OB strength rating, from 1 to 5 stars, one star per criterion met:
V - the OB candle volume is at least 1.5 times its 20-period average
I - the impulse from the OB to the structure break is at least 3 ATR(14)
R - the best bounce after a retest of the zone is at least 2 ATR(14)
F - the impulse leaving the OB left a fair value gap
S - the OB swept liquidity: its candle went beyond the last confirmed swing low (bullish OB) or swing high (bearish OB), then a close came back within a set number of candles
More stars make the box less transparent. All thresholds are adjustable.
5. OB volume weight. Each OB volume is compared with the average of the last 50 OBs of the same timeframe and direction. Heavy OBs get a solid border, and the group label shows the multiple and rank of the heaviest one (for example "vol x2.4 top 3%").
6. FVG strength rating (optional, off by default), from 1 to 5 stars, measured in the FVG's own timeframe:
V - the volume of the middle candle is at least 1.5 times its 20-candle average
D - at least 65 percent of the middle candle volume goes in the FVG direction (estimated from where the candle closed within its range)
T - the gap is at least 10 percent of the largest gap of the last 1000 candles
O - the FVG touches a same-direction OB
I - the FVG is still mostly intact (filled less than 50 percent)
More stars make the FVG less transparent, the stars can be written at the start of each FVG, and FVGs below a chosen number of stars can be hidden.
7. End of zones. A zone ends at the first chart-timeframe close through it: the box either stops at the break or is hidden.
8. FVG options: minimum size in ATR, strong middle candle, only the unfilled part, only the nearest FVGs, only FVGs touching an OB, outline with a 50 percent line, short boxes, and separate colours (blue and violet by default) so FVGs are not confused with OBs. FVGs of several timeframes that overlap become more visible.
HOW TO USE IT
- Add it to any chart. The default "Wide" list covers 1m to 1M. The legend in the bottom-left corner shows which timeframes are computed for OBs and for FVGs.
- Darker areas are where boxes of several timeframes stack up. The labels tell you which timeframes are involved, the best star rating in the group and the heaviest volume.
- Bullish OBs are green and bearish OBs are red. The border style can be set per timeframe class, from lower to higher timeframes.
- If the chart is too busy, lower the number of OBs per side, narrow the timeframe range, raise the minimum number of overlapping timeframes, set a maximum distance from price, or hide the FVGs below a number of stars.
- To see only the FVGs, untick "Show order blocks".
HOW IT AVOIDS REPAINTING
Every timeframe is requested without lookahead, and each one only returns zones from its last closed candle. A higher-timeframe zone therefore appears only after that higher-timeframe candle has closed and does not change afterwards.
Note that an OB box starts at the time of the OB candle, which is in the past: the zone is only known once the later structure break confirms it, and it is then drawn back from its origin candle. This is how order blocks work in general, not a lookahead.
LIMITS
- TradingView allows 40 requests per script and 500 boxes per script. With the 36-timeframe list the script is heavy: lower the history per timeframe if it is slow. When the box limit is reached, a warning appears in the legend and some zones are not drawn.
- Lower timeframes only go back as far as their history setting allows (for example 1500 one-minute candles is about 25 hours), so older low-timeframe zones are not found.
- The buy / sell split of the FVG rating is an estimate from a single candle, not real order flow.
- Results depend on the volume data of the symbol. On symbols without volume, the volume criteria and the volume weight are not meaningful.
- This is a visual tool to read price structure. It does not give buy or sell signals, makes no claim about win rate, and past zones do not guarantee future reactions.
SETTINGS LANGUAGE
All settings, tooltips and labels are in English.
發行說明
Update 2026-10-28- Light OBs lose one star: an OB whose volume is below the average of the last OBs of the same TF and side (1x by default, adjustable) gets one star less. Our tests showed that lighter-than-usual OBs break more often than random zones, while heavy OBs do not hold better than random zones: volume is used as a warning sign, not as a quality sign.
- Zone labels now show the average volume multiple of all OBs in the zone, plus the heaviest one: "vol x1.3 (max x3.2 top 4%)". Can be turned off.
- Tooltips: hover (or tap) a zone label to see every OB of the zone on its own line, highest timeframe at the top, with its stars and volume multiple. Prices are optional.
- Detailed labels when they fit: with the auto price scale, a zone shows one label per OB, stacked inside the zone, as soon as it is tall enough on screen. Otherwise it keeps its single merged label. Note: the script recalculates when you scroll or zoom; untick the option if the chart becomes slow.
- New ON / OFF group at the top of the settings: order blocks, fair value gaps, OB stars, FVG stars, legend, tooltips.
發行說明
Update 2026-10-28OB STARS
- Light OBs lose one star: an OB whose volume is below the average of the last 50 OBs of the same TF and side (1x by default, adjustable, can be turned off) gets one star less and is marked "light". Our tests (BTC, ETH, SOL, XRP, 15m / 1h / 4h, 2020-2026) showed that lighter-than-usual OBs break more often than random zones, while heavy OBs do not hold better than random zones: volume is used as a warning sign, not as a quality sign.
- In "One label per OB" mode, light OBs show "light" in their label.
ZONE LABELS
- The zone label now shows the average volume multiple of all its OBs (below 1x included), then the heaviest one: "vol x1.3 (max x3.2 top 4%)". A single OB keeps "vol x3.2 top 4%". New option to hide this volume text.
- Zone labels always stay on one line per zone, whatever the zoom.
TOOLTIPS (new)
- Hover (or tap) a zone label to see every OB of the zone on its own line: highest timeframe at the top, lowest at the bottom (heaviest first within the same timeframe), with nested mark, stars, volume multiple and rank for every OB, and "light" when it applies.
- Prices of each OB in the tooltip: optional, off by default.
SETTINGS
- New ON / OFF group at the top of the settings: Show order blocks, Show fair value gaps, Rate OB strength, Rate FVG strength, Legend, Tooltips on the zone labels, Prices in the tooltips.
- The legend position stays in DISPLAY.
發行說明
Update 2026-10-31- New: hover tooltips on the FVGs. A small « FVG (n) » label now marks the start of each group of overlapping same-direction FVGs. Hover (or tap) it to see every FVG of the zone on its own line: timeframe (highest at the top), direction, how much of it is already filled, its stars, and its prices if « Prices in the tooltips » is ticked. New switch « Tooltips on the FVG zones » in the ON / OFF group (on by default).
- OB labels are cleaner: the « ◆ » sign was removed from the labels. Nested OBs (inside a higher-TF OB) are still marked ◆ in the zone tooltip.
- New defaults: « Hide Overlap » unticked in the FAIR VALUE GAP group; label text white at 25 % opacity.
Note: an update keeps the settings of the indicator already on your chart. To get the new defaults, remove and re-add the indicator, or use « Reset settings ».

免責聲明
這些資訊和出版物並非旨在提供,也不構成TradingView提供或認可的任何形式的財務、投資、交易或其他類型的建議或推薦。請閱讀使用條款以了解更多資訊。