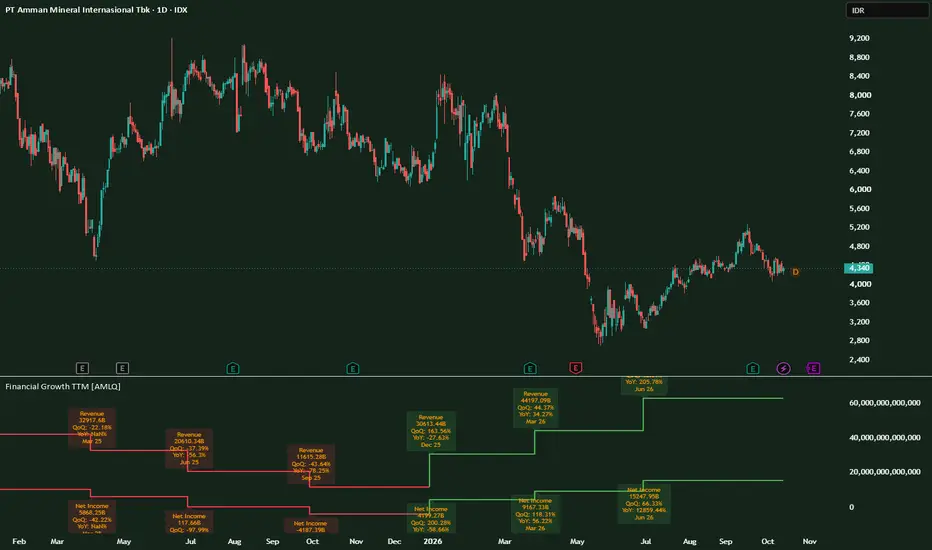
Financial Growth TTM [AMLQ]
Reading Fundamentals Directly on Your Chart
Most traders analyze price action in isolation, checking quarterly earnings in a separate tab or financial report. However, price trends are ultimately anchored by corporate earnings power. Financial Growth TTM [AMLQ] bridges this gap by bringing Trailing Twelve Months (TTM) fundamental data directly beneath your price chart as step-line trends, complete with automated quarter-over-quarter (QoQ) and year-over-year (YoY) performance metrics.
Core Concept: Why TTM Matters
Single-quarter earnings can be noisy and heavily distorted by seasonal fluctuations (for example, retail surges in Q4 or quiet periods during festive holidays). Using Trailing Twelve Months (TTM) smooths out seasonal spikes by summing the four most recent operating quarters.
When a company releases new quarterly financial statements:
Key Features
Step-Line Trajectory: Renders corporate earnings updates as clean step levels, reflecting how financial statements are published once per quarter rather than interpolating continuous daily moves.
Compact Nominal Values: Automatically formats large headline figures into readable denominations (B for Billions, M for Millions, and K for Thousands) to eliminate visual clutter.
Dynamic Color-Coded Momentum: Stepline colors dynamically adapt based on sequential growth:
On-Chart Growth Tags: Every time a new filing is recognized, a detailed tag marks:
How to Use It in Your Workflow
Chart Scale Setup Tip
By default, the script plots Total Revenue and Net Income directly on a standard nominal scale, leaving Operating Income toggled off to maintain a clean reading.
Because Revenue figures are naturally much higher than Net Income, you can right-click the vertical axis of the indicator pane in TradingView and select Auto (Fits Data to Screen) or Logarithmic Scale for balanced visual spacing between both lines.
Most traders analyze price action in isolation, checking quarterly earnings in a separate tab or financial report. However, price trends are ultimately anchored by corporate earnings power. Financial Growth TTM [AMLQ] bridges this gap by bringing Trailing Twelve Months (TTM) fundamental data directly beneath your price chart as step-line trends, complete with automated quarter-over-quarter (QoQ) and year-over-year (YoY) performance metrics.
Core Concept: Why TTM Matters
Single-quarter earnings can be noisy and heavily distorted by seasonal fluctuations (for example, retail surges in Q4 or quiet periods during festive holidays). Using Trailing Twelve Months (TTM) smooths out seasonal spikes by summing the four most recent operating quarters.
When a company releases new quarterly financial statements:
- A rising TTM line confirms an expanding business base.
- A plateau or rollover warns of top-line or bottom-line exhaustion long before annual reports are published.
Key Features
Step-Line Trajectory: Renders corporate earnings updates as clean step levels, reflecting how financial statements are published once per quarter rather than interpolating continuous daily moves.
Compact Nominal Values: Automatically formats large headline figures into readable denominations (B for Billions, M for Millions, and K for Thousands) to eliminate visual clutter.
Dynamic Color-Coded Momentum: Stepline colors dynamically adapt based on sequential growth:
- Green: Positive sequential growth (QoQ expanding).
- Red: Sequential contraction (QoQ declining).
- Gray: Flat or neutral performance.
On-Chart Growth Tags: Every time a new filing is recognized, a detailed tag marks:
- Metric name (Revenue, Operating Income, or Net Income)
- Nominal TTM figure
- Sequential growth rate (QoQ %)
- Annualized growth rate (YoY %)
- Period timestamp (Month and Year)
How to Use It in Your Workflow
- Trend Confirmation: Compare the direction of price on the upper pane with the trajectory of Net Income on the lower pane. An uptrend backed by steady green steps indicates fundamental accumulation.
- Fundamental Divergence: If price breaks out to fresh highs while the TTM Net Income line rolls over into red, the rally is driven purely by multiple expansion rather than earnings growth—a clear signal to manage risk.
- Margin Health: Keep both Revenue and Net Income toggled on. If Revenue continues climbing higher while Net Income flattens or turns red, cost pressures are compressing operating margins.
Chart Scale Setup Tip
By default, the script plots Total Revenue and Net Income directly on a standard nominal scale, leaving Operating Income toggled off to maintain a clean reading.
Because Revenue figures are naturally much higher than Net Income, you can right-click the vertical axis of the indicator pane in TradingView and select Auto (Fits Data to Screen) or Logarithmic Scale for balanced visual spacing between both lines.

CFTe with an award.
Trading System Designer at Alpha Market Lab Quantum. See our services and products at alphamarketlab.com/
Trading System Designer at Alpha Market Lab Quantum. See our services and products at alphamarketlab.com/
免責聲明
這些資訊和出版物並非旨在提供,也不構成TradingView提供或認可的任何形式的財務、投資、交易或其他類型的建議或推薦。請閱讀使用條款以了解更多資訊。
CFTe with an award.
Trading System Designer at Alpha Market Lab Quantum. See our services and products at alphamarketlab.com/
Trading System Designer at Alpha Market Lab Quantum. See our services and products at alphamarketlab.com/
免責聲明
這些資訊和出版物並非旨在提供,也不構成TradingView提供或認可的任何形式的財務、投資、交易或其他類型的建議或推薦。請閱讀使用條款以了解更多資訊。