已更新
Risk-Off Ladder [Simple]
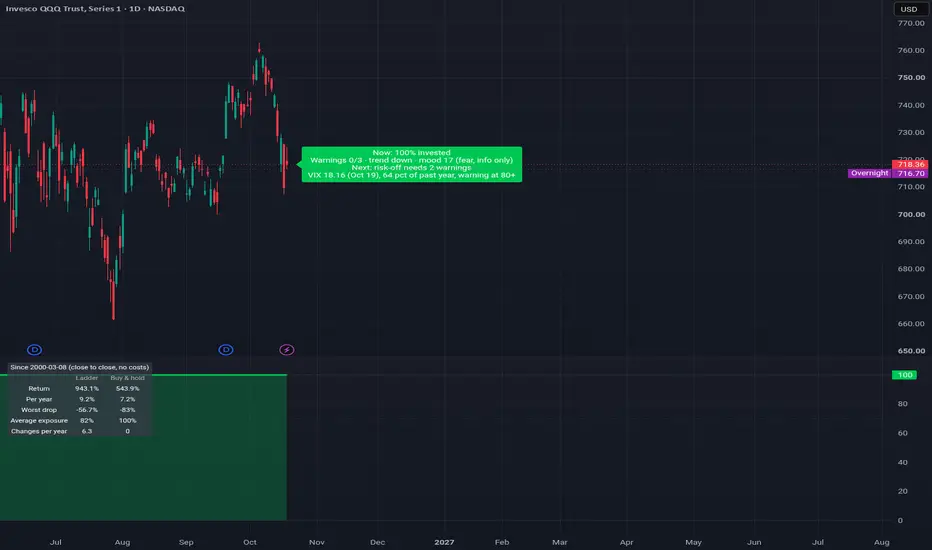
Risk-Off Ladder answers one question: how much should I hold right now? Most of the time the answer is 100%. It steps aside only when the market shows real trouble, and it comes back quickly once a rebound starts.
Every change is a big label on the price chart that shows the action and the result:
BUY → 100%, BUY → 70%, SELL 30% → 70%, SELL ALL → 0%
The risk check (3 warnings):
1. The VIX is in the top 20% of its past year.
2. Price closes below its 200-day average.
3. Price is more than 15% below its one-year high.
The rules (fixed round numbers, no strategy inputs to tweak):
- 0 or 1 warnings: 100%.
- 2 warnings (risk-off): 0%. But if SuperTrend (10, 3) turns up while still in risk-off, it buys back to 70% (a rebound). If SuperTrend turns down again, it goes back to 0%.
- 3 warnings: 0%.
- Moves to 0% and buys from 0% happen at once. Any other change waits at least 10 bars, which keeps changes to about 4–6 a year in normal markets.
How it differs from Trend Safety Switch: Trend Safety Switch sells on every SuperTrend flip down. This ladder ignores SuperTrend while the market is healthy and stays fully invested. It uses SuperTrend only inside risk-off, as the signal to start buying back.
What you see:
- Labels on price. Green BUY, orange partial SELL, red SELL ALL. The small second line gives the reason.
- Exposure pane. A step line colored green (100%), lime (70%) or red (0%).
- Red background on price while risk-off is on.
- "Now" readout. Exposure, warnings out of 3, trend, and what would change it next. It also shows a fear / greed mood reading from the Market Fear Meter gauge; this is for context only and does not change the rules.
- Results table. The ladder vs buy-and-hold since a start date you pick: return, per year, worst drop, average exposure and changes per year. It compounds close to close with no costs, so treat it as a rough guide.
No repainting: everything is decided at the bar close. The VIX is read on the chart's timeframe with no lookahead.
Alerts:
- "BUY (exposure up)", "SELL part", "SELL ALL (risk-off)" and "Any exposure change".
- Or one "Any alert() function call" alert. Its message includes the new exposure and the reason.
Honest backtest (daily, signal at the close and fill at the next open, 0.02% commission plus $0.02 slippage per order):
- QQQ since 2000:
- Ladder +1,166% (9.9% a year), worst drop −46%, about 81% invested, about 6 changes a year.
- Buy-and-hold +817% (8.6% a year), worst drop −83%.
- QQQ since 2010:
- Ladder 14.5% a year, worst drop −23%.
- Buy-and-hold 18.7% a year, worst drop −35%.
- SPY since 2000:
- Ladder 7.3% a year, worst drop −35%.
- Buy-and-hold 8.3% a year, worst drop −55%.
- SPY since 2010:
- Ladder 10.9% a year, worst drop −27%.
- Buy-and-hold 14.0% a year, worst drop −34%.
- 2025 to Oct 2026:
- QQQ: ladder +28% vs buy-and-hold +39%.
- SPY: ladder +23% vs +32%.
- In strong bull years it lags buy-and-hold. Since 2010 the gap is about 3–4% a year. The benefit is a smaller worst drop and earlier re-entry after crashes.
- Choppy bear markets whipsaw it. In 2022 SPY lost about as much as buy-and-hold. In 2020 SPY it ended slightly negative while buy-and-hold made +18%.
Tips:
- It was built and tested on daily charts of broad US index ETFs.
- For other markets, turn off the VIX warning.
- Use it as a guide for how heavy to be, together with your own plan.
Credits:
- SuperTrend: Olivier Seban. The band and flip code is based on KivancOzbilgic's open-source SuperTrend, which credits everget.
- Williams VIX Fix (mood reading only): Larry Williams. The spike code is based on ChrisMoody's CM_Williams_Vix_Fix.
- The risk check and ladder are my own. They build on my earlier free scripts, Trend Safety Switch and Market Fear Meter.
Disclaimer:
- This is for education only and is not financial advice.
- Backtests are hypothetical, and past results do not predict future results.
- Trading involves risk of loss.
Next: I'll post this ladder's live signals on QQQ and SPY here as they happen, good and bad, so you can judge it in real time.
Every change is a big label on the price chart that shows the action and the result:
BUY → 100%, BUY → 70%, SELL 30% → 70%, SELL ALL → 0%
The risk check (3 warnings):
1. The VIX is in the top 20% of its past year.
2. Price closes below its 200-day average.
3. Price is more than 15% below its one-year high.
The rules (fixed round numbers, no strategy inputs to tweak):
- 0 or 1 warnings: 100%.
- 2 warnings (risk-off): 0%. But if SuperTrend (10, 3) turns up while still in risk-off, it buys back to 70% (a rebound). If SuperTrend turns down again, it goes back to 0%.
- 3 warnings: 0%.
- Moves to 0% and buys from 0% happen at once. Any other change waits at least 10 bars, which keeps changes to about 4–6 a year in normal markets.
How it differs from Trend Safety Switch: Trend Safety Switch sells on every SuperTrend flip down. This ladder ignores SuperTrend while the market is healthy and stays fully invested. It uses SuperTrend only inside risk-off, as the signal to start buying back.
What you see:
- Labels on price. Green BUY, orange partial SELL, red SELL ALL. The small second line gives the reason.
- Exposure pane. A step line colored green (100%), lime (70%) or red (0%).
- Red background on price while risk-off is on.
- "Now" readout. Exposure, warnings out of 3, trend, and what would change it next. It also shows a fear / greed mood reading from the Market Fear Meter gauge; this is for context only and does not change the rules.
- Results table. The ladder vs buy-and-hold since a start date you pick: return, per year, worst drop, average exposure and changes per year. It compounds close to close with no costs, so treat it as a rough guide.
No repainting: everything is decided at the bar close. The VIX is read on the chart's timeframe with no lookahead.
Alerts:
- "BUY (exposure up)", "SELL part", "SELL ALL (risk-off)" and "Any exposure change".
- Or one "Any alert() function call" alert. Its message includes the new exposure and the reason.
Honest backtest (daily, signal at the close and fill at the next open, 0.02% commission plus $0.02 slippage per order):
- QQQ since 2000:
- Ladder +1,166% (9.9% a year), worst drop −46%, about 81% invested, about 6 changes a year.
- Buy-and-hold +817% (8.6% a year), worst drop −83%.
- QQQ since 2010:
- Ladder 14.5% a year, worst drop −23%.
- Buy-and-hold 18.7% a year, worst drop −35%.
- SPY since 2000:
- Ladder 7.3% a year, worst drop −35%.
- Buy-and-hold 8.3% a year, worst drop −55%.
- SPY since 2010:
- Ladder 10.9% a year, worst drop −27%.
- Buy-and-hold 14.0% a year, worst drop −34%.
- 2025 to Oct 2026:
- QQQ: ladder +28% vs buy-and-hold +39%.
- SPY: ladder +23% vs +32%.
- In strong bull years it lags buy-and-hold. Since 2010 the gap is about 3–4% a year. The benefit is a smaller worst drop and earlier re-entry after crashes.
- Choppy bear markets whipsaw it. In 2022 SPY lost about as much as buy-and-hold. In 2020 SPY it ended slightly negative while buy-and-hold made +18%.
Tips:
- It was built and tested on daily charts of broad US index ETFs.
- For other markets, turn off the VIX warning.
- Use it as a guide for how heavy to be, together with your own plan.
Credits:
- SuperTrend: Olivier Seban. The band and flip code is based on KivancOzbilgic's open-source SuperTrend, which credits everget.
- Williams VIX Fix (mood reading only): Larry Williams. The spike code is based on ChrisMoody's CM_Williams_Vix_Fix.
- The risk check and ladder are my own. They build on my earlier free scripts, Trend Safety Switch and Market Fear Meter.
Disclaimer:
- This is for education only and is not financial advice.
- Backtests are hypothetical, and past results do not predict future results.
- Trading involves risk of loss.
Next: I'll post this ladder's live signals on QQQ and SPY here as they happen, good and bad, so you can judge it in real time.
發行說明
v1.1- VIX fix: the risk check now always uses the VIX close of the same trading day as the chart bar. On a live last bar (for example during overnight trading) the VIX feed could be on a different day, which could show a wrong warning count in the Now readout. Past bars, signals and the results table are unchanged.
- The Now readout now shows the VIX value and its percentile of the past year.
- Corrected the QQQ since 2000 backtest in the description: +792% (8.5% a year), worst drop -64%, vs buy-and-hold +817% (8.6% a year), -83%. The earlier figure came from a test model that started later in 2000. Other results are unchanged.

免責聲明
這些資訊和出版物並非旨在提供,也不構成TradingView提供或認可的任何形式的財務、投資、交易或其他類型的建議或推薦。請閱讀使用條款以了解更多資訊。
免責聲明
這些資訊和出版物並非旨在提供,也不構成TradingView提供或認可的任何形式的財務、投資、交易或其他類型的建議或推薦。請閱讀使用條款以了解更多資訊。