OPEN-SOURCE SCRIPT
已更新 Expansion Failure Planner [AGPro Series]
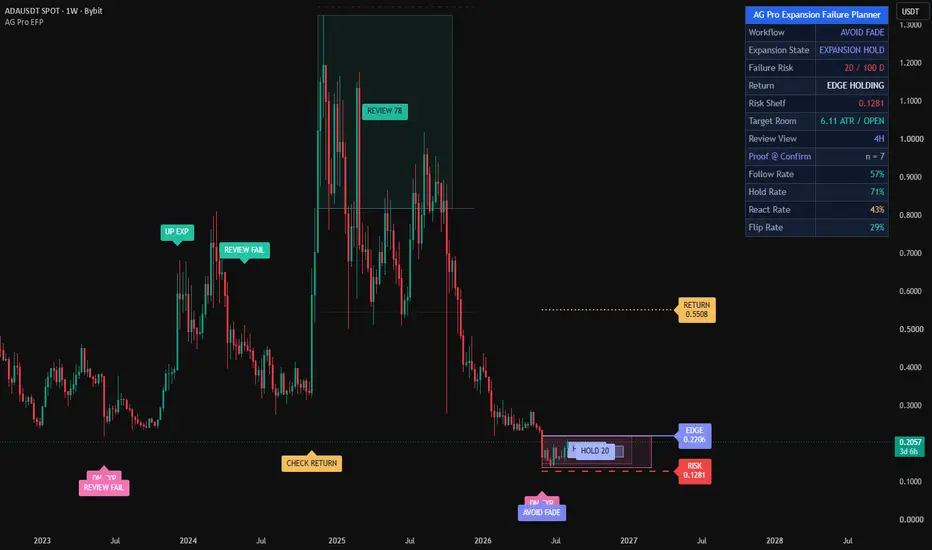
Expansion Failure Planner [AGPro Series]
🧠 Core Idea
Did volatility expansion create real travel, or did it fail back inside the prior structure?
📌 Overview / What it does
Expansion Failure Planner is a public-free TradingView indicator built to evaluate failed volatility expansion attempts. It detects when price expands beyond a recent range edge, then tracks whether the move produces meaningful travel or quickly loses the edge.
The script produces a failed expansion corridor, expansion-edge guide, risk shelf, return-to-range target guide, compact state labels, alerts, and a clean AG Pro planning panel. It does not predict future price direction or automate trade decisions.
🎯 Purpose & Design Philosophy
This script was built for traders who do not only want to see that volatility expanded. They want to know whether the expansion still has quality, whether failure risk is rising, and what context should be reviewed next.
The design supports a decision-first workflow: identify the expansion attempt, measure failure risk, review target room, and decide whether the context deserves attention.
⚡ Why This Script Is Different
Most volatility tools focus on expansion, squeeze release, or breakout continuation.
This script does NOT act as a generic breakout signal, generic S/R zone, or continuation-only volatility map.
Instead, it focuses on one narrow question: did the expansion fail before producing real travel?
⚙️ Methodology
1. Context Detection
The script defines a prior range and watches for a volatility expansion attempt beyond that range edge.
2. Reference Mapping
It stores the expansion edge, expansion extreme, prior range midpoint, and return-to-range target area.
3. Reaction Evaluation
The planner scores failed travel using ATR expansion, close-back-inside behavior, missing follow-through, volume response, and range re-entry quality.
4. Visual Output
It draws the failed expansion corridor, expansion edge, risk shelf, return target, compact labels, and a premium AG Pro panel.
🗺️ How to Read the Chart
Zones = the failed expansion corridor between the original edge and the expansion extreme.
Labels = expansion attempts, failure-ready states, watch states, hold states, and reset context.
Colors = teal for upside expansion attempts, pink for downside expansion attempts, yellow for watch context, and indigo for edge/hold review.
Panel = the preferred viewing timeframe, current expansion state, 0-100 failure risk, reclaim status, target room, and next action.
🚦 Signals & States
• UP EXP / DN EXP → a volatility expansion attempt has been detected.
• UP FAIL / DN FAIL → the expansion failed back inside the prior structure with enough score.
• WATCH → failure risk is developing but confirmation is incomplete.
• HOLD → expansion is still holding beyond the edge.
• RESET / NO FAIL → the active failure window expired or real travel invalidated the failure context.
🔔 Alerts Logic
Alerts trigger when expansion failure reaches ready status, when watch context develops, when expansion holds beyond the edge, or when the failure window resets.
Alerts are attention markers only. They are not trade instructions.
🧩 Confluence Logic
The strongest context appears when ATR expansion, edge loss, missing follow-through, range re-entry, and participation align. When these components agree, the failure risk score increases.
📊 When to Use
• After volatility expansion attempts
• Around range-edge probes
• During breakout failure review
• When a move expands but does not travel
• When price quickly returns inside prior structure
⚠️ When NOT to Use
• Extremely low-liquidity symbols
• Very noisy micro ranges
• News-driven candles with abnormal gaps
• Markets where volume data is unreliable
• Charts where the prior range is not structurally meaningful
🎛️ Key Inputs
• Sensitivity → changes how strict the failure model is.
• Prior Range Lookback → defines the structure used for expansion reference.
• Expansion Bar ATR → controls how large a candle must be to qualify.
• Required Real Travel ATR → defines how much progress the expansion should produce.
• Confirmation Mode → controls close/volume/strict confirmation.
• Visual Settings → control corridor, guides, labels, projection, and label size.
• Panel Settings → control panel visibility, location, theme, font size, and best-viewed timeframe guidance.
🖥️ Interface & Visual Design
The panel is designed as a compact planning cockpit. The first row uses the AGPro merged blue header standard, while the remaining rows show best-viewed timeframe guidance, state, score, reclaim status, target room, and action.
The visual hierarchy keeps the chart readable: one active corridor, clear guide lines, and controlled labels.
🧪 Practical Usage Workflow
1. Read the panel state.
2. Check whether price is above or below the expansion edge.
3. Review the failed expansion corridor.
4. Compare failure risk with target room.
5. Use alerts as attention markers, not decisions.
🔍 Interpretation Guidelines
Think in terms of failed travel, not prediction. A high score means the script detected stronger failure characteristics. A low score means expansion may still be holding, or failure evidence is not strong enough.
🚫 What This Script Is NOT
• Not a prediction engine
• Not financial advice
• Not auto trading
• Not guaranteed signals
• Not a generic breakout indicator
• Not a generic support/resistance zone map
⚠️ Limitations & Transparency
• Timeframe differences can change expansion and failure structure.
• Volatility spikes can distort ATR-based scoring.
• Volume quality varies by market.
• Fast markets can move beyond the corridor before confirmation.
• Outputs should be interpreted within broader market context.
🧠 Market Context Notes
Expansion failure often matters when volatility appears strong but cannot create distance. This script focuses on that transition point between momentum attempt and failed travel.
🧾 Use Case Examples
When price expands above a range, stalls quickly, closes back inside the edge, and fails to build distance, the planner can mark an upside expansion failure.
When price expands below a range, loses downside follow-through, and re-enters the structure, the planner can mark a downside expansion failure.
🧱 System Philosophy
AGPro tools are built to reduce chart ambiguity by turning raw market events into structured decision context.
🔐 Non-Promise Statement
No indicator can provide certainty. This script provides rule-based context only.
📉 Risk Disclosure
Trading involves risk. Users are responsible for their own decisions. This script does not provide financial advice or guaranteed trading outcomes.
📚 Educational Note
Use the script as a structured learning and review tool for expansion failure behavior, failed travel, and volatility response.
🧠 Core Idea
Did volatility expansion create real travel, or did it fail back inside the prior structure?
📌 Overview / What it does
Expansion Failure Planner is a public-free TradingView indicator built to evaluate failed volatility expansion attempts. It detects when price expands beyond a recent range edge, then tracks whether the move produces meaningful travel or quickly loses the edge.
The script produces a failed expansion corridor, expansion-edge guide, risk shelf, return-to-range target guide, compact state labels, alerts, and a clean AG Pro planning panel. It does not predict future price direction or automate trade decisions.
🎯 Purpose & Design Philosophy
This script was built for traders who do not only want to see that volatility expanded. They want to know whether the expansion still has quality, whether failure risk is rising, and what context should be reviewed next.
The design supports a decision-first workflow: identify the expansion attempt, measure failure risk, review target room, and decide whether the context deserves attention.
⚡ Why This Script Is Different
Most volatility tools focus on expansion, squeeze release, or breakout continuation.
This script does NOT act as a generic breakout signal, generic S/R zone, or continuation-only volatility map.
Instead, it focuses on one narrow question: did the expansion fail before producing real travel?
⚙️ Methodology
1. Context Detection
The script defines a prior range and watches for a volatility expansion attempt beyond that range edge.
2. Reference Mapping
It stores the expansion edge, expansion extreme, prior range midpoint, and return-to-range target area.
3. Reaction Evaluation
The planner scores failed travel using ATR expansion, close-back-inside behavior, missing follow-through, volume response, and range re-entry quality.
4. Visual Output
It draws the failed expansion corridor, expansion edge, risk shelf, return target, compact labels, and a premium AG Pro panel.
🗺️ How to Read the Chart
Zones = the failed expansion corridor between the original edge and the expansion extreme.
Labels = expansion attempts, failure-ready states, watch states, hold states, and reset context.
Colors = teal for upside expansion attempts, pink for downside expansion attempts, yellow for watch context, and indigo for edge/hold review.
Panel = the preferred viewing timeframe, current expansion state, 0-100 failure risk, reclaim status, target room, and next action.
🚦 Signals & States
• UP EXP / DN EXP → a volatility expansion attempt has been detected.
• UP FAIL / DN FAIL → the expansion failed back inside the prior structure with enough score.
• WATCH → failure risk is developing but confirmation is incomplete.
• HOLD → expansion is still holding beyond the edge.
• RESET / NO FAIL → the active failure window expired or real travel invalidated the failure context.
🔔 Alerts Logic
Alerts trigger when expansion failure reaches ready status, when watch context develops, when expansion holds beyond the edge, or when the failure window resets.
Alerts are attention markers only. They are not trade instructions.
🧩 Confluence Logic
The strongest context appears when ATR expansion, edge loss, missing follow-through, range re-entry, and participation align. When these components agree, the failure risk score increases.
📊 When to Use
• After volatility expansion attempts
• Around range-edge probes
• During breakout failure review
• When a move expands but does not travel
• When price quickly returns inside prior structure
⚠️ When NOT to Use
• Extremely low-liquidity symbols
• Very noisy micro ranges
• News-driven candles with abnormal gaps
• Markets where volume data is unreliable
• Charts where the prior range is not structurally meaningful
🎛️ Key Inputs
• Sensitivity → changes how strict the failure model is.
• Prior Range Lookback → defines the structure used for expansion reference.
• Expansion Bar ATR → controls how large a candle must be to qualify.
• Required Real Travel ATR → defines how much progress the expansion should produce.
• Confirmation Mode → controls close/volume/strict confirmation.
• Visual Settings → control corridor, guides, labels, projection, and label size.
• Panel Settings → control panel visibility, location, theme, font size, and best-viewed timeframe guidance.
🖥️ Interface & Visual Design
The panel is designed as a compact planning cockpit. The first row uses the AGPro merged blue header standard, while the remaining rows show best-viewed timeframe guidance, state, score, reclaim status, target room, and action.
The visual hierarchy keeps the chart readable: one active corridor, clear guide lines, and controlled labels.
🧪 Practical Usage Workflow
1. Read the panel state.
2. Check whether price is above or below the expansion edge.
3. Review the failed expansion corridor.
4. Compare failure risk with target room.
5. Use alerts as attention markers, not decisions.
🔍 Interpretation Guidelines
Think in terms of failed travel, not prediction. A high score means the script detected stronger failure characteristics. A low score means expansion may still be holding, or failure evidence is not strong enough.
🚫 What This Script Is NOT
• Not a prediction engine
• Not financial advice
• Not auto trading
• Not guaranteed signals
• Not a generic breakout indicator
• Not a generic support/resistance zone map
⚠️ Limitations & Transparency
• Timeframe differences can change expansion and failure structure.
• Volatility spikes can distort ATR-based scoring.
• Volume quality varies by market.
• Fast markets can move beyond the corridor before confirmation.
• Outputs should be interpreted within broader market context.
🧠 Market Context Notes
Expansion failure often matters when volatility appears strong but cannot create distance. This script focuses on that transition point between momentum attempt and failed travel.
🧾 Use Case Examples
When price expands above a range, stalls quickly, closes back inside the edge, and fails to build distance, the planner can mark an upside expansion failure.
When price expands below a range, loses downside follow-through, and re-enters the structure, the planner can mark a downside expansion failure.
🧱 System Philosophy
AGPro tools are built to reduce chart ambiguity by turning raw market events into structured decision context.
🔐 Non-Promise Statement
No indicator can provide certainty. This script provides rule-based context only.
📉 Risk Disclosure
Trading involves risk. Users are responsible for their own decisions. This script does not provide financial advice or guaranteed trading outcomes.
📚 Educational Note
Use the script as a structured learning and review tool for expansion failure behavior, failed travel, and volatility response.
發行說明
UPDATE NOTES - V1.1This update focuses on visual readability, workflow clarity, panel structure, and publication-ready chart interpretation.
The core purpose of the script remains unchanged.
This release improves how the existing expansion-failure logic is presented, organized, and interpreted on the chart.
This script continues to function as an analytical and visualization tool.
It does not attempt to predict price direction or provide guaranteed outcomes.
------------------------
What Changed
------------------------
* Rebuilt the visual layer from the published V1.0 baseline.
The update keeps the original expansion-failure logic intact while improving how the chart story is displayed.
* Restored a fuller chart narrative.
Attempt labels, active review labels, projected corridors, and recent corridor memory are all balanced so the chart does not feel empty between active failure windows.
* Reworked corridor labels with premium contrast-safe inner tag boxes.
Zone text now sits inside each corridor as a wider colored badge, avoiding white or transparent native box text that can disappear on light charts.
* Upgraded inner corridor badge styling.
Corridor badges now use a solid contrast-safe format such as FAIL 82, WATCH 54, HOLD 31, REVIEW 74, and EDGE 60. Each badge keeps a filled in-zone backing while the text is rendered with a standard chart-label layer for clearer readability on light and dark charts.
* Added controlled corridor memory.
Recent meaningful review, return, hold, and near-watch corridors can remain visible after reset while older zones are pruned automatically.
* Refined workflow language.
States now use action-oriented wording such as REVIEW FAILURE, CHECK RETURN, AVOID FADE, TRACK EDGE, and WAIT EXPANSION.
* Rebuilt the panel flow.
The panel now prioritizes Workflow, Expansion State, Failure Risk, Return, Risk Shelf, Target Room, and Review View.
* Improved panel lifecycle handling.
The panel recreates safely when location, theme, font size, or visibility settings are changed.
* Increased controlled default density.
Default visible labels and visible zones were adjusted to preserve a richer publication screenshot without turning the chart into a signal board.
------------------------
Visual Improvements
------------------------
* Improved chart readability by keeping zone text inside the corridor with a dedicated contrast-safe inner tag.
* Reduced visual ambiguity around failed-expansion, return, and hold zones.
* Preserved recent corridor context so completed zones still contribute to the visual story.
* Restored the published-version attempt-label rhythm with compact UP EXP and DN EXP labels.
* Refined visual hierarchy so the corridor, risk shelf, return target, and workflow labels are easier to scan.
* Adjusted label positioning to keep event labels away from candle bodies and wicks.
* Tuned event and context label spacing so active labels remain separated from corridor tags while preserving a fuller chart story.
* Improved light-theme readability by removing white/near-white zone text and using colored in-zone tags with dark text.
* Reduced duplicate context labels while corridors are visible so the inner zone badge remains the primary zone annotation.
------------------------
Interface & Usability
------------------------
* Optimized panel layout for clearer information flow.
* Preserved panel show, location, theme, and font-size controls.
* Preserved label font-size control while rendering inner corridor badge text at the same size as normal chart labels and giving the in-zone badge area more horizontal and vertical room.
* Adjusted default visual behavior for a fuller chart story without changing the core model.
* Enhanced overall user experience without changing the underlying analytical logic.
------------------------
Behavior Notes
------------------------
This update does not change the core analytical logic of the script.
The goal is to improve clarity and usability, not to introduce new predictive behavior.
Users should interpret outputs the same way as before, but with improved visual structure and workflow wording.
------------------------
Limitations Reminder
------------------------
The script remains a rule-based analytical tool.
Market conditions such as volatility, liquidity, volume quality, and timeframe differences may affect how expansion attempts and failure labels appear.
Outputs should always be interpreted within broader market context.
------------------------
Risk Reminder
------------------------
This script is for educational and analytical purposes only.
It does not provide financial advice or guaranteed trading outcomes.
Users remain responsible for their own decisions.
發行說明
🔧 UPDATE NOTES - V1.3This update focuses on memory-zone polish and publication screenshot clarity.
The core purpose of the script remains unchanged.
This release improves the visual layer introduced in V1.2 by simplifying archived corridor badges and reducing chart heaviness.
This script continues to function as an analytical and visualization tool.
It does not attempt to predict price direction or provide guaranteed outcomes.
------------------------
What Changed
------------------------
• Simplified memory corridor badges
Archived corridor badges now use a single clean label layer instead of a copied badge box plus label stack.
• Reduced memory-zone heaviness
The default visible memory zone count was adjusted from 4 to 3 for a cleaner public chart while keeping the control available.
• Preserved active corridor clarity
The active corridor still keeps its centered premium badge, guide lines, right-side guide tags, panel, alerts, and scoring logic.
• Preserved all analytical features
Expansion attempts, failure scoring, risk shelf, return target, guide tags, event labels, memory zones, and panel behavior remain available.
------------------------
Visual Improvements
------------------------
• Removed the extra framed badge layer from archived HOLD / WATCH / FAIL corridor memories
• Reduced old-zone clutter while keeping enough chart story visible
• Improved first-glance polish for screenshots with several completed expansion corridors
• Kept right-side EDGE / RISK / RETURN tags attached to their real guide levels
------------------------
Interface & Usability
------------------------
• Max Visible Zones remains adjustable
• Show Guide Tags and Guide Tag Offset Bars remain available
• Label font size, panel font size, panel theme, panel location, event labels, context labels, and reset labels remain unchanged
------------------------
Behavior Notes
------------------------
This update does not change the core analytical logic of the script.
The goal is to improve clarity and usability, not to introduce new predictive behavior.
Users should interpret outputs the same way as before, but with cleaner archived-zone presentation.
------------------------
Limitations Reminder
------------------------
The script remains a rule-based analytical tool.
Market conditions such as volatility, liquidity, timeframe differences, and fast structure changes may affect how expansion-failure states appear.
Outputs should always be interpreted within broader market context.
------------------------
Risk Reminder
------------------------
This script is for educational and analytical purposes only.
It does not provide financial advice or guaranteed trading outcomes.
Users remain responsible for their own decisions.
發行說明
🔧 UPDATE NOTES - v1.4This update focuses on decision confidence and proof.
The core purpose of the script remains unchanged.
This release adds a confirmation-anchored proof layer that measures how often flagged
expansion attempts returned inside before the risk shelf was breached.
This script continues to function as an analytical and visualization tool.
It does not attempt to predict price direction or provide guaranteed outcomes.
------------------------
What Changed
------------------------
• Added a Proof Layer (Follow / Hold / React / Flip)
The panel now reports how reliably flagged expansion attempts played out as failures on the
current symbol and timeframe. Each time an attempt is flagged, it is tracked forward over a
configurable horizon with the expansion edge frozen as the reference, the failure-fade
target set to one risk unit (1R) inside (or the range mid if it is closer), and the risk
shelf frozen beyond the expansion extreme:
- Follow Rate : share of attempts whose failure fade advanced one risk unit inside (or
reached a nearer range mid) before the risk shelf was breached
- Hold Rate : share whose risk shelf was not breached through resolution
- React Rate : share that produced an early favorable return reaction
- Flip Rate : share whose risk shelf was breached within the horizon (expansion held)
A sample size (n) is shown so the rates are read in context, and they display as
"building" only until the first flagged attempt resolves.
• Added hidden data outputs
The Follow / Hold / React / Flip rates are now exported as hidden plots so they can be
referenced by alerts, screeners, or other tools without changing the chart visuals.
------------------------
Visual Improvements
------------------------
• Grouped the proof metrics into a clean block under a dedicated "Proof @ Confirm" heading,
below the existing expansion-failure rows.
• Preserved the existing failed expansion corridor, centered inner corridor tag, expansion
edge, risk shelf, return target guides, guide tags, memory zones, and event labels.
• Refined panel structure so the workflow, expansion state, failure risk, return, risk
shelf, target room, and proof context form a single, scannable card.
• Kept the inner corridor tag centered in its corridor and all event labels offset away
from candles for clean readability.
------------------------
Interface & Usability
------------------------
• Optimized panel layout for clearer information flow with the new proof block.
• Improved at-a-glance interpretation by reporting how often flagged attempts returned
inside before the risk shelf.
• Adjusted default visual settings for a more balanced appearance.
• Added a Proof input group (show/hide, proof horizon bars, reaction window bars, reaction
progress threshold) so the proof layer is fully configurable without affecting the core
expansion-failure logic.
------------------------
Behavior Notes
------------------------
This update does not change the core analytical logic of the script.
The proof rates are descriptive statistics of flagged expansion attempts on the current
symbol and timeframe. They measure how often an attempt's failure fade advanced one risk unit inside (or
reached a nearer range mid) before the risk shelf, not trade performance, and they do not
change how the failure score or
expansion state is classified.
Users should interpret outputs the same way as before, now with added reliability context.
------------------------
Limitations Reminder
------------------------
The script remains a rule-based analytical tool.
Proof rates depend on the amount of available history and on how many expansion attempts
have been flagged on the current symbol and timeframe; a small sample (low n) should be
treated with caution. Each flagged attempt is counted once, with the expansion edge, fade
target, and risk shelf frozen at the attempt. Market conditions such as volatility,
liquidity, and timeframe differences may affect how attempts and rates appear.
Outputs should always be interpreted within broader market context.
------------------------
Risk Reminder
------------------------
This script is for educational and analytical purposes only.
It does not provide financial advice or guaranteed trading outcomes.
Users remain responsible for their own decisions.
發行說明
Version 1.5 — Refined Visual HierarchyThis update improves chart clarity and active-workflow visibility while preserving the script’s existing expansion analysis, failure-risk model, return mapping, proof methodology, alerts, and panel behavior.
• Reduced the default maximum number of visible event labels from 14 to 8. Recent expansion and failure events now remain informative without allowing older labels to dominate the chart.
• Reduced the default number of retained corridor zones from 3 to 2. The active corridor and the most relevant recent structure now receive stronger visual priority.
• Increased the default event-label cooldown from 18 to 24 bars. Expansion attempts, failure states, holds, and avoidance labels are now distributed more evenly across the chart.
• Retained Normal as the default label font size. This preserves readability across the centered corridor badge, event labels, and guide tags without creating additional overlap.
• Preserved all expansion-state detection, failure-risk scoring, risk-shelf mapping, return-target calculations, proof tracking, and alert conditions. This release changes presentation defaults only.
開源腳本
秉持TradingView一貫精神,這個腳本的創作者將其設為開源,以便交易者檢視並驗證其功能。向作者致敬!您可以免費使用此腳本,但請注意,重新發佈代碼需遵守我們的社群規範。

Trading Suite | Flagship Workflow :
tradingview.com/script/XJmX3p98-Trading-Suite-AGPro-Series/
Crypto Setup Planner | Multi-Symbol Analysis :
tradingview.com/script/LgVRo7Ql-Crypto-Setup-Planner-AGPro-Series/
tradingview.com/script/XJmX3p98-Trading-Suite-AGPro-Series/
Crypto Setup Planner | Multi-Symbol Analysis :
tradingview.com/script/LgVRo7Ql-Crypto-Setup-Planner-AGPro-Series/
免責聲明
這些資訊和出版物並非旨在提供,也不構成TradingView提供或認可的任何形式的財務、投資、交易或其他類型的建議或推薦。請閱讀使用條款以了解更多資訊。
開源腳本
秉持TradingView一貫精神,這個腳本的創作者將其設為開源,以便交易者檢視並驗證其功能。向作者致敬!您可以免費使用此腳本,但請注意,重新發佈代碼需遵守我們的社群規範。
Trading Suite | Flagship Workflow :
tradingview.com/script/XJmX3p98-Trading-Suite-AGPro-Series/
Crypto Setup Planner | Multi-Symbol Analysis :
tradingview.com/script/LgVRo7Ql-Crypto-Setup-Planner-AGPro-Series/
tradingview.com/script/XJmX3p98-Trading-Suite-AGPro-Series/
Crypto Setup Planner | Multi-Symbol Analysis :
tradingview.com/script/LgVRo7Ql-Crypto-Setup-Planner-AGPro-Series/
免責聲明
這些資訊和出版物並非旨在提供,也不構成TradingView提供或認可的任何形式的財務、投資、交易或其他類型的建議或推薦。請閱讀使用條款以了解更多資訊。