已更新
Premkt 5 15 30 Min
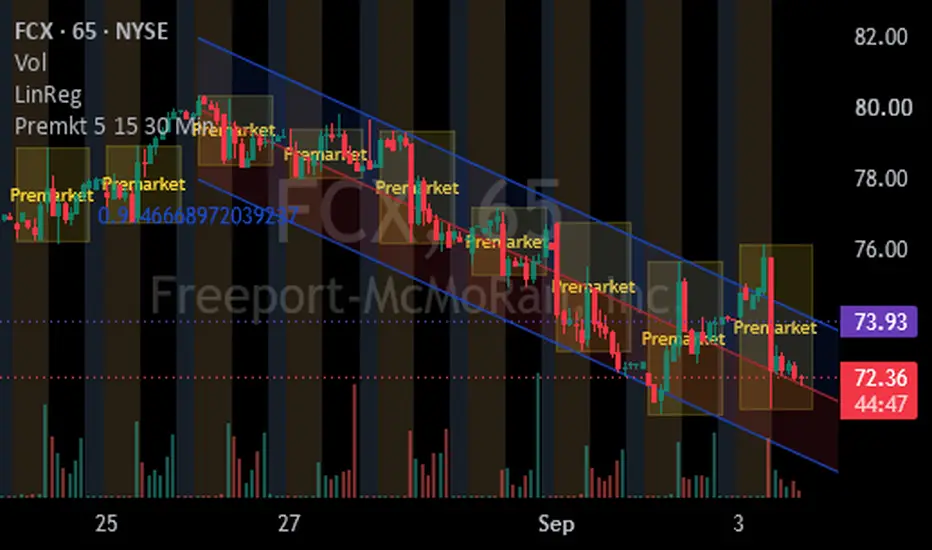
If your trading focuses on the Premarket range or the first 5, 15 or 30 Minutes of the market, you might like this script.
It automatically creates different colored rectangles for each of these timeframes.
Each rectangle displays the Title in the color of the rectangle.
Premarket displays from 0400 to 1600 Market time.
The 5, 15 and 30 Minute display from 0930 to 1600, although they don't appear until that timeframe has completed.
The 15 and 30 Minute display a dashed horizontal line at the 50% level in the same color as the Title.
User adjustable features: colors and opacity and show/hide on the chart.
When hidden, the Title and 50% line for that rectangle also hides.
The rectangles are retained on prior days for quick visual on a multi-day chart.
It automatically creates different colored rectangles for each of these timeframes.
Each rectangle displays the Title in the color of the rectangle.
Premarket displays from 0400 to 1600 Market time.
The 5, 15 and 30 Minute display from 0930 to 1600, although they don't appear until that timeframe has completed.
The 15 and 30 Minute display a dashed horizontal line at the 50% level in the same color as the Title.
User adjustable features: colors and opacity and show/hide on the chart.
When hidden, the Title and 50% line for that rectangle also hides.
The rectangles are retained on prior days for quick visual on a multi-day chart.
發行說明
The current day's rectangles are now being retained for historical reference. 發行說明
Added user control for number of days to retain the rectangles. Options from 10 days as default, up to Max. The true Max Bo and Line count is 500 but I restricted it to 450 to ensure no system conflicts.
免責聲明
這些資訊和出版物並非旨在提供,也不構成TradingView提供或認可的任何形式的財務、投資、交易或其他類型的建議或推薦。請閱讀使用條款以了解更多資訊。
免責聲明
這些資訊和出版物並非旨在提供,也不構成TradingView提供或認可的任何形式的財務、投資、交易或其他類型的建議或推薦。請閱讀使用條款以了解更多資訊。