OPEN-SOURCE SCRIPT
20/200 Simple Moving Average
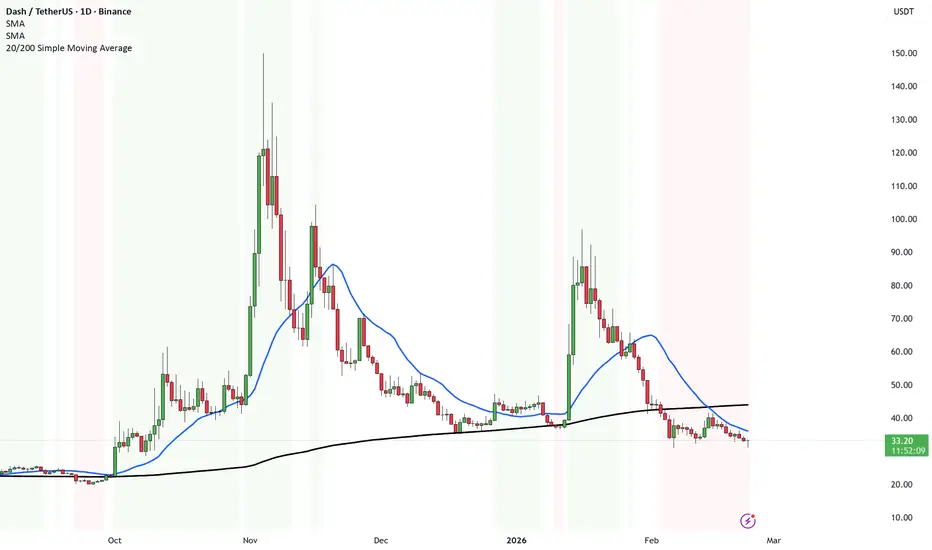
This indicator shows you the big trend vs the medium trend — and colors the chart so you don’t have to think too much.
Here’s what it does in simple terms:
What are the two lines?
20 SMA = the average price of the last 20 candles → short/medium-term direction.
200 SMA = the average price of the last 200 candles → long-term trend.
Think of it like:
20 = recent behavior.
200 = overall direction.
What the Background Colors Mean
🟢 Green Background
Price is ABOVE both the 20 and the 200.
That means:
Short-term trend is strong.
Long-term trend is bullish.
Market structure is healthy.
This is bullish territory.
🔴 Red Background
Price is BELOW both the 20 and the 200.
That means:
Short-term trend is weak.
Long-term trend is bearish.
Sellers are in control.
This is bearish territory.
⚪ White / No Color
Price is stuck between the two averages.
That means:
No clear trend.
Market is deciding.
Higher chance of chop.
Buy & Sell Signals (Crossovers)
Buy Territory:
When the 20 crosses ABOVE the 200 and price is already above the 200.
That’s momentum shifting bullish inside a confirmed trend.
Sell Territory:
When the 20 crosses BELOW the 200 and price is already below the 200.
That’s momentum turning bearish in a downtrend.
In very simple words:
Green = strong uptrend.
Red = strong downtrend.
White = messy middle.
Here’s what it does in simple terms:
What are the two lines?
20 SMA = the average price of the last 20 candles → short/medium-term direction.
200 SMA = the average price of the last 200 candles → long-term trend.
Think of it like:
20 = recent behavior.
200 = overall direction.
What the Background Colors Mean
🟢 Green Background
Price is ABOVE both the 20 and the 200.
That means:
Short-term trend is strong.
Long-term trend is bullish.
Market structure is healthy.
This is bullish territory.
🔴 Red Background
Price is BELOW both the 20 and the 200.
That means:
Short-term trend is weak.
Long-term trend is bearish.
Sellers are in control.
This is bearish territory.
⚪ White / No Color
Price is stuck between the two averages.
That means:
No clear trend.
Market is deciding.
Higher chance of chop.
Buy & Sell Signals (Crossovers)
Buy Territory:
When the 20 crosses ABOVE the 200 and price is already above the 200.
That’s momentum shifting bullish inside a confirmed trend.
Sell Territory:
When the 20 crosses BELOW the 200 and price is already below the 200.
That’s momentum turning bearish in a downtrend.
In very simple words:
Green = strong uptrend.
Red = strong downtrend.
White = messy middle.
開源腳本
秉持TradingView一貫精神,這個腳本的創作者將其設為開源,以便交易者檢視並驗證其功能。向作者致敬!您可以免費使用此腳本,但請注意,重新發佈代碼需遵守我們的社群規範。

🌐NEW Website 2025:
mati-trader.lovable.app/
✅ Facebook:
facebook.com/groups/matitrader
𝕏 (Formerly Twitter):
twitter.com/timonr
Trade Well,
Timon Rossolimos
Founder, MATI Trader
(Pro trader since 2003)
mati-trader.lovable.app/
✅ Facebook:
facebook.com/groups/matitrader
𝕏 (Formerly Twitter):
twitter.com/timonr
Trade Well,
Timon Rossolimos
Founder, MATI Trader
(Pro trader since 2003)
免責聲明
這些資訊和出版物並非旨在提供,也不構成TradingView提供或認可的任何形式的財務、投資、交易或其他類型的建議或推薦。請閱讀使用條款以了解更多資訊。
開源腳本
秉持TradingView一貫精神,這個腳本的創作者將其設為開源,以便交易者檢視並驗證其功能。向作者致敬!您可以免費使用此腳本,但請注意,重新發佈代碼需遵守我們的社群規範。
🌐NEW Website 2025:
mati-trader.lovable.app/
✅ Facebook:
facebook.com/groups/matitrader
𝕏 (Formerly Twitter):
twitter.com/timonr
Trade Well,
Timon Rossolimos
Founder, MATI Trader
(Pro trader since 2003)
mati-trader.lovable.app/
✅ Facebook:
facebook.com/groups/matitrader
𝕏 (Formerly Twitter):
twitter.com/timonr
Trade Well,
Timon Rossolimos
Founder, MATI Trader
(Pro trader since 2003)
免責聲明
這些資訊和出版物並非旨在提供,也不構成TradingView提供或認可的任何形式的財務、投資、交易或其他類型的建議或推薦。請閱讀使用條款以了解更多資訊。