Gold RSI Trend Pullback M15
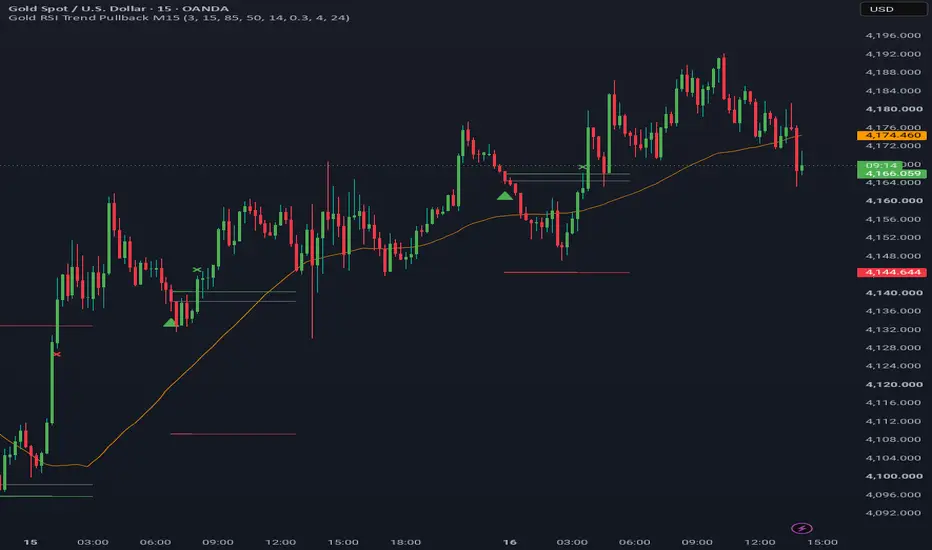
# RSI(3) Trend Pullback (ATR exits)
**What it does**
Marks short-term pullbacks in the direction of the trend. It gives a buy signal when RSI(3) closes below 15 while the close is above SMA(50), and a sell signal when RSI(3) closes above 85 while the close is below SMA(50). Each signal gets a take-profit at 0.3 x ATR(14), a stop-loss at 4 x ATR(14), and a time exit after 24 bars. The script tracks one trade at a time and plots the entry, TP and SL levels. It has alerts for signals, TP hits, SL hits and time exits. The idea follows the widely published short-period RSI pullback concept, and this script is an original implementation.
**Non-repainting**
Signals and exits are only evaluated on confirmed (closed) bars, and the script doesn't request any higher-timeframe data.
**How it was tested (author's own test, XAUUSD M15, built from M1 data)**
Entry at the next bar's open, a spread cost of 0.3 points per trade, and TP/SL resolved on M1 bars, with the stop counted first when both are hit in the same minute. 2025 data was used for tuning, and 2026 was kept as an out-of-sample check.
| Period | Trades | Win rate | Net points | Profit factor | Max drawdown (points) |
|---|---|---|---|---|---|
| 2025 (tuning) | 409 | 93.4% | +96.1 | 1.22 | 79.4 |
| 2026 Jan to Oct (out-of-sample) | 350 | 93.7% | +154.0 | 1.19 | 154.8 |
**Important limitations**
The win rate is high because the target is small and the stop is large. A single loss can wipe out many wins, and the edge per trade is small compared with spread and slippage. Gold trended strongly upward over the test period, so behaviour in other conditions may differ. Past results don't guarantee future results.
**Disclaimer**
This script is for educational and research purposes only and is not financial advice. Test it yourself and manage your risk.
**What it does**
Marks short-term pullbacks in the direction of the trend. It gives a buy signal when RSI(3) closes below 15 while the close is above SMA(50), and a sell signal when RSI(3) closes above 85 while the close is below SMA(50). Each signal gets a take-profit at 0.3 x ATR(14), a stop-loss at 4 x ATR(14), and a time exit after 24 bars. The script tracks one trade at a time and plots the entry, TP and SL levels. It has alerts for signals, TP hits, SL hits and time exits. The idea follows the widely published short-period RSI pullback concept, and this script is an original implementation.
**Non-repainting**
Signals and exits are only evaluated on confirmed (closed) bars, and the script doesn't request any higher-timeframe data.
**How it was tested (author's own test, XAUUSD M15, built from M1 data)**
Entry at the next bar's open, a spread cost of 0.3 points per trade, and TP/SL resolved on M1 bars, with the stop counted first when both are hit in the same minute. 2025 data was used for tuning, and 2026 was kept as an out-of-sample check.
| Period | Trades | Win rate | Net points | Profit factor | Max drawdown (points) |
|---|---|---|---|---|---|
| 2025 (tuning) | 409 | 93.4% | +96.1 | 1.22 | 79.4 |
| 2026 Jan to Oct (out-of-sample) | 350 | 93.7% | +154.0 | 1.19 | 154.8 |
**Important limitations**
The win rate is high because the target is small and the stop is large. A single loss can wipe out many wins, and the edge per trade is small compared with spread and slippage. Gold trended strongly upward over the test period, so behaviour in other conditions may differ. Past results don't guarantee future results.
**Disclaimer**
This script is for educational and research purposes only and is not financial advice. Test it yourself and manage your risk.

免責聲明
這些資訊和出版物並非旨在提供,也不構成TradingView提供或認可的任何形式的財務、投資、交易或其他類型的建議或推薦。請閱讀使用條款以了解更多資訊。