EonMetrics AMD Phases (Power of Three)
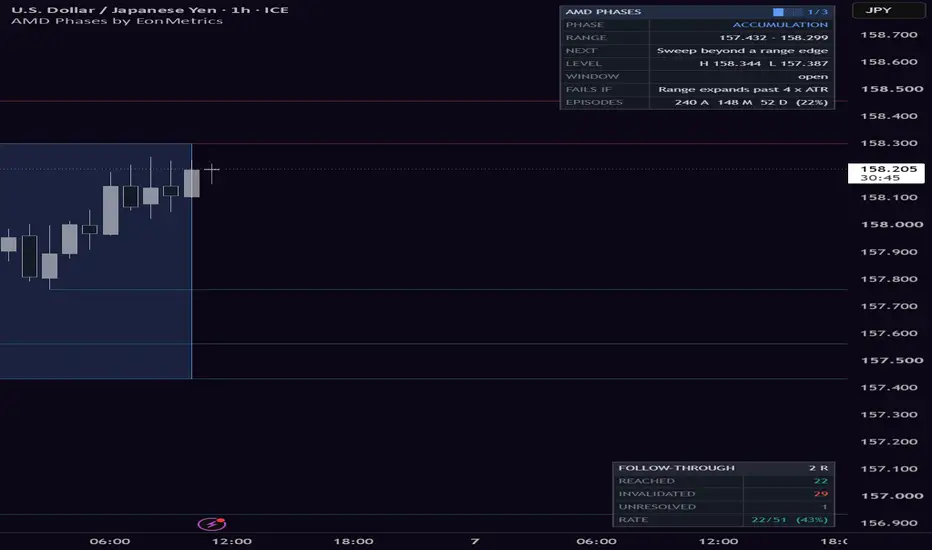
AMD Phases (Power of Three) by EonMetrics

🔶WHAT IT DOES
"AMD" stands for Accumulation, Manipulation, Distribution — a classic three-step pattern also known as the "Power of Three". The idea behind the model: price first goes quiet and builds a tight sideways range (accumulation), then briefly pokes out of that range to trigger the stop-losses resting just beyond it and immediately comes back inside (manipulation — a failed breakout, often called a stop hunt or liquidity sweep), and finally makes its real move in the opposite direction of that fake-out (distribution).
This indicator finds and labels these three phases on your chart, in order, as each one completes — and, through a live panel, tells you at every moment which phase is confirmed, which step the model requires next, and at exactly what price the script will register that step.
It is a structure-annotation tool. It does not give buy/sell signals or entry orders. It measures, on the history loaded in your chart, what price actually did after each completed sequence and shows you that count, and it draws the measured objective on the chart as a reference marker — a level the tool measures against, never a recommendation to place an order there.
🔶THE LIVE PANEL — THE PART THAT WORKS WHILE THE PATTERN IS STILL FORMING
A phase label can only be drawn once that phase has already finished. The panel covers everything before that moment: it reads the script's own state machine out loud, row by row:
- PHASE — which of the three steps is confirmed right now, with a 3-block meter. SCANNING means no qualifying range yet. SWEEP HIGH / SWEEP LOW means an edge was pierced but price has not yet closed back inside, so manipulation is NOT confirmed yet.
- RANGE — the locked upper and lower edge of the current accumulation range.
- NEXT — the step the AMD model requires next.
- LEVEL — the exact price at which this script will register that step: the sweep trigger levels while accumulating, the reclaim price while a sweep is pending, the confirmation level while waiting for distribution.
- WINDOW — how many bars are left before the current episode times out and is discarded.
- FAILS IF — the specific condition that would invalidate the episode.
- EPISODES — a running count on the history loaded in your chart: how many ranges locked (A), how many of those were swept and reclaimed (M), how many reached distribution confirmation (D), and what percentage of locked ranges completed the whole sequence.
Read NEXT and LEVEL as "this is the condition the script is waiting for", never as "this is what price will do". The AMD sequence frequently does not complete. That is precisely why the EPISODES row is built into the panel and why failed episodes stay drawn on the chart by default — so the completion rate you see is the one your own market actually produced, not a selected highlight.
🔶HOW IT DETECTS EACH PHASE (THE EXACT METHOD)
1. Accumulation ("A" label + blue box): the script measures the total height (highest high minus lowest low) of the last N bars. When that height stays below a chosen multiple of ATR (a standard volatility measure) for enough consecutive closed bars, the area qualifies as an accumulation range and its top and bottom edges are locked in. While price keeps quietly respecting the range, the box keeps extending.
2. Manipulation ("M" label + orange box): after the range is set, the script waits for price to pierce one of the edges by at least a minimum ATR-scaled distance (so a one-tick poke does not count). This alone is NOT manipulation yet — the pierce only counts if price then FAILS to hold outside and closes back inside the range within a small number of bars. If any bar closes beyond the pierced edge and the strict option is enabled, the move is treated as a genuine breakout and the episode is discarded. Only a failed, reclaimed sweep gets the "M" mark.
Optionally, the sweep can be required to also trade through a confirmed swing high or swing low — an actual resting-liquidity level — rather than merely poking past the box edge. This is the strictest available definition of a stop hunt in the script: it rejects pierces of an arbitrary boundary that collected no stops, at the cost of far fewer episodes.
3. Distribution ("D" label, teal for up / red for down): after the failed sweep, the script watches a limited window of bars for confirmation in the opposite direction. By default this confirmation is a structure break, measured against the rolling structure extreme in the 2 × Swing Length bars ending with the sweep. A close beyond that extreme means the sweeping move has been undone. You can switch the confirmation to a close beyond the range midpoint, or beyond the opposite edge of the range (strictest — this requires price to cross the whole range). If price instead takes out the manipulation extreme, or the window runs out, the episode is discarded as failed.
4. Liquidity pools (thin red and teal lines): independently of the phase episodes, the script draws a horizontal line at every confirmed swing high (red, above price) and swing low (teal, below price) — the classic levels where resting stop-loss orders accumulate. Each line stops extending the moment price trades through it, so untapped liquidity stays visible while collected liquidity visibly ends. These lines give context to the phases: sweeps and structure breaks usually happen exactly at them. The levels are tracked internally whether or not the lines are displayed.

Everything is evaluated on closed bars only, so labels and boxes do not repaint: once a phase is marked, it stays where it was marked. Only the panel's WINDOW countdown and the current price levels update as new bars close.
🔶ORIGINALITY
This is not a generic session box or a sweep marker. It uses one closed-bar state machine that requires all three phases to occur in order: a compressed range, a reclaimed sweep beyond that range, and a separately confirmed move away from the swept side. The panel makes the state of that sequence visible before it completes, including its exact confirmation and failure conditions.
The script also keeps failed episodes visible by default and counts them alongside completed ones. That makes the chart show the full record of the model on loaded history, rather than only its completed examples. The Follow-Through table is a separate measurement layer: it evaluates what happened after confirmed sequences using levels derived from each sequence itself.
🔶THE FOLLOW-THROUGH TABLE — WHAT HAPPENED AFTER THE PATTERN COMPLETED
Completing a pattern and going somewhere afterwards are two different things, so the script measures the second one separately and shows the count in its own small table.
Every level in that measurement comes from the pattern itself, not from a setting you have to guess:
- The reference price is the closing price of the confirmation bar — the bar that produced the "D".
- The risk unit is the distance from that price back to the manipulation extreme, the tip of the sweep. That is the level the model itself treats as invalidation, so it defines one unit of risk.
- The objective is that same distance multiplied by the "Risk / Reward (RR)" setting, in the confirmed direction.
Starting with the first completed bar after confirmation, the script follows price until one of two things happens first: the objective is reached, or price returns to the manipulation extreme. The table reports REACHED, INVALIDATED, UNRESOLVED (still running) and the resulting RATE, for example 20/35 (57%).
At the moment of each confirmation the objective level is also drawn on the chart as a short horizontal line, tagged with the R multiple you chose (1R, 2R, and so on). It is the exact level the table measures against, placed there so you can see where the measurement is taken. It is a marker of the measurement, not a take-profit order and not a recommendation to trade to it — the same caution the whole table carries applies to the line.
The RATE is coloured against the indifference line for the objective you chose, which is 100 / (1 + objective) percent — 50% at a 1.0 objective, 33% at 2.0, 25% at 3.0. That is simply the rate at which the two outcomes cancel each other out arithmetically, before any trading costs. The colour marks which side of that line this particular history fell on; it does not mean the pattern is or is not profitable, because commissions, spread and slippage appear nowhere in this table.
After confirmation, bars where price touched both levels are counted as INVALIDATED, because the order of events inside a single bar cannot be determined from this data. That is the conservative choice and it means the REACHED count is, if anything, understated. The confirmation bar itself establishes the reference price and is not evaluated as a follow-through outcome.
Read this table as a description of what this pattern did on the history your chart happens to have loaded, on the settings you happen to have chosen. It is not a backtest of a trading system: it contains no commission, no spread, no slippage, no position sizing and no partial exits. It is not a forecast. Change the symbol, the timeframe, the settings or the amount of history your plan loads and the number will change. If you find yourself adjusting settings until this number looks good, you are fitting the settings to the past, and the number stops telling you anything.
🔶HOW TO ACTUALLY USE IT (STEP BY STEP)
1. When a blue "A" box appears, price is compressing. The panel switches to ACCUMULATION and shows the two sweep trigger prices. Liquidity is building above and below that box.
2. When one of those trigger prices is reached, the panel switches to SWEEP HIGH or SWEEP LOW and starts a countdown. This is the moment the model is being tested: price must close back inside the range before the window runs out, or the episode is discarded as a real breakout.
3. When the orange "M" mark appears, the sweep was reclaimed. The panel now shows the confirmation level for distribution and a fresh countdown. The failed breakout side tells you which resting stops were just collected.
4. When the "D" mark appears, price has confirmed movement away from the swept side (teal "D" = confirmed up after a sweep of the lows, red "D" = confirmed down after a sweep of the highs). The three-phase sequence is complete.
5. Check the EPISODES row before you trust the pattern on a new symbol or timeframe. If the completion percentage on your instrument is low, the model is simply not describing that market well — the panel tells you that honestly instead of hiding it.
6. Combine the phase marks with your own analysis (trend, higher-timeframe levels, session times). The indicator describes structure and reports the state of a model; it does not predict price.
🔶EVERY SETTING EXPLAINED
🔹Accumulation group
- ATR Length — the length of the volatility measure that scales every threshold in the script. Larger = slower to adapt to volatility changes.
- Range Window (bars) — how many recent bars are checked for compression. Larger windows find bigger, slower ranges.
- Max Range Height (x ATR) — how tight the window must be to count as accumulation. Lower = stricter and rarer ranges, higher = looser and more frequent.
- Min Range Age (bars) — how many consecutive closed bars the compression must hold before the range qualifies. Filters out one-bar pauses.
- Episode Cooldown (bars) — how many bars must pass after an episode ends before a new range may qualify. Prevents overlapping back-to-back boxes over the same congestion area.
🔹Manipulation group
- Min Sweep Depth (x ATR) — how far beyond the range edge the wick must reach to count as a sweep. Raise it to ignore shallow pokes; set to 0 to accept any pierce.
- Reclaim Window (bars) — how quickly price must close back inside the range after the sweep. Short = only sharp stop-hunts count; longer = slower fake-outs also count.
- Allow Closes Beyond The Edge — ON (default) tolerates closes outside the swept edge as long as price returns within the reclaim window, so deeper stop-hunts also count. OFF is the strictest definition of a fake-out: any close beyond the swept edge cancels the episode (wicks only).
- Sweep Must Take Out A Liquidity Pool — OFF (default) accepts any sufficiently deep pierce of the range edge. ON additionally requires the same bar to trade through a confirmed swing high or low, so only sweeps that actually reached resting liquidity start a manipulation phase. Expect far fewer episodes with this on.
🔹Distribution group
- Confirmation Level — what counts as the real move: a close beyond the origin of the sweeping leg (Structure Break, default), beyond the range midpoint, or beyond the OPPOSITE edge of the range (strictest, requires crossing the entire range).
- Confirmation Window (bars) — how long after the reclaim the confirmation may arrive before the episode is discarded. Shorter windows produce fewer completed sequences.
🔹Follow-Through group
- Show Follow-Through Table — toggles the outcome table described above.
- Risk / Reward (RR) — how far price must travel in the confirmed direction, as a multiple of the distance from the confirmation close back to the manipulation extreme. Raising it makes the objective harder to reach. This same multiple also sets where the objective line is drawn and what its tag reads.
- Draw Objective Line On Chart — after each distribution, draws a short horizontal line at the measured objective, tagged with the R multiple. It marks the level the table measures against; it is not an order recommendation. Turn it off to keep the chart clean and rely on the table alone.
- Objective Line Length (bars) — how far to the right the objective line and its tag extend.
- Objective Line — the color of that line and tag.
- Position — placement of the table.
🔹Liquidity Pools group
- Show Pool Lines — toggles the swing high/low liquidity lines. Detection is unaffected; the levels are always tracked.
- Swing Length (bars) — how dominant a high/low must be (highest/lowest among this many bars on both sides) to count as a swing pivot. Larger = fewer, more significant pivots. This setting also feeds the Structure Break confirmation and the liquidity-pool sweep filter.
- Max Pool Lines Per Side — how many pool lines are kept before the oldest are removed.
- Highs / Lows — the two line colors.
🔹Display group
- Show Phase Boxes / Show A / M / D Labels — toggle the drawing layers separately.
- Keep Failed Episodes (dimmed) — keep discarded episodes on the chart, dimmed and dashed, for honest review; or remove them instantly.
- Max Episodes On Chart — how many past episodes stay on the chart before the oldest drawings are cleaned up.
- Colors — accumulation, manipulation, distribution up and distribution down colors.
🔹Panel group
- Show Live Phase Panel — toggles the panel described above.
- Position / Text Size / Dark Theme — placement and styling of the panel.
🔹Alerts group
- Accumulation Formed, Range Edge Swept (unconfirmed), Manipulation Confirmed, Distribution Confirmed, Episode Failed — enable the events you care about, then create ONE alert on this indicator and pick "Any alert() function call" in the TradingView alert window. Messages include the symbol, timeframe and the relevant price levels. The "Range Edge Swept" alert fires on an unconfirmed sweep, before the reclaim — it is an early heads-up, not a confirmation, and it will often be followed by a failed episode.
🔶LIMITATIONS AND WHAT THIS TOOL DELIBERATELY DOES NOT DO
No buy or sell signals, no entry orders, no stop-loss levels, no probability or confidence score. The objective line the script draws is the level the Follow-Through table measures against, tagged with the R multiple — it is a measurement marker, not a take-profit recommendation. Detecting a structural pattern is not the same as having a tradable edge, and presenting pattern marks as trade signals would overstate what any indicator of this kind can honestly claim.
The two counters report different things and neither is a trading result. EPISODES measures pattern completion — how often the A-M-D sequence finished at all. FOLLOW-THROUGH measures what price did after it finished, against a distance derived from the pattern. Both are computed only on the bars currently loaded in your chart, both ignore trading costs entirely, and both will change with your symbol, timeframe, settings and the amount of history your plan loads. Neither number is a claim about future performance, and no result from either counter is implied or promised anywhere in this description.
The panel's NEXT and LEVEL rows state the conditions defined by the model, not a forecast. A sequence that reaches manipulation frequently fails before distribution, and a completed sequence is not a prediction that the move will continue.
Ranges, sweeps and structure breaks all depend on the settings you choose; different parameters produce different episodes on the same chart. Treat the defaults as a starting point and check the EPISODES row when you change them.
This tool is for analysis and education. It is not financial advice. Always do your own analysis and manage your own risk.
🔶WHAT IT DOES
"AMD" stands for Accumulation, Manipulation, Distribution — a classic three-step pattern also known as the "Power of Three". The idea behind the model: price first goes quiet and builds a tight sideways range (accumulation), then briefly pokes out of that range to trigger the stop-losses resting just beyond it and immediately comes back inside (manipulation — a failed breakout, often called a stop hunt or liquidity sweep), and finally makes its real move in the opposite direction of that fake-out (distribution).
This indicator finds and labels these three phases on your chart, in order, as each one completes — and, through a live panel, tells you at every moment which phase is confirmed, which step the model requires next, and at exactly what price the script will register that step.
It is a structure-annotation tool. It does not give buy/sell signals or entry orders. It measures, on the history loaded in your chart, what price actually did after each completed sequence and shows you that count, and it draws the measured objective on the chart as a reference marker — a level the tool measures against, never a recommendation to place an order there.
🔶THE LIVE PANEL — THE PART THAT WORKS WHILE THE PATTERN IS STILL FORMING
A phase label can only be drawn once that phase has already finished. The panel covers everything before that moment: it reads the script's own state machine out loud, row by row:
- PHASE — which of the three steps is confirmed right now, with a 3-block meter. SCANNING means no qualifying range yet. SWEEP HIGH / SWEEP LOW means an edge was pierced but price has not yet closed back inside, so manipulation is NOT confirmed yet.
- RANGE — the locked upper and lower edge of the current accumulation range.
- NEXT — the step the AMD model requires next.
- LEVEL — the exact price at which this script will register that step: the sweep trigger levels while accumulating, the reclaim price while a sweep is pending, the confirmation level while waiting for distribution.
- WINDOW — how many bars are left before the current episode times out and is discarded.
- FAILS IF — the specific condition that would invalidate the episode.
- EPISODES — a running count on the history loaded in your chart: how many ranges locked (A), how many of those were swept and reclaimed (M), how many reached distribution confirmation (D), and what percentage of locked ranges completed the whole sequence.
Read NEXT and LEVEL as "this is the condition the script is waiting for", never as "this is what price will do". The AMD sequence frequently does not complete. That is precisely why the EPISODES row is built into the panel and why failed episodes stay drawn on the chart by default — so the completion rate you see is the one your own market actually produced, not a selected highlight.
🔶HOW IT DETECTS EACH PHASE (THE EXACT METHOD)
1. Accumulation ("A" label + blue box): the script measures the total height (highest high minus lowest low) of the last N bars. When that height stays below a chosen multiple of ATR (a standard volatility measure) for enough consecutive closed bars, the area qualifies as an accumulation range and its top and bottom edges are locked in. While price keeps quietly respecting the range, the box keeps extending.
2. Manipulation ("M" label + orange box): after the range is set, the script waits for price to pierce one of the edges by at least a minimum ATR-scaled distance (so a one-tick poke does not count). This alone is NOT manipulation yet — the pierce only counts if price then FAILS to hold outside and closes back inside the range within a small number of bars. If any bar closes beyond the pierced edge and the strict option is enabled, the move is treated as a genuine breakout and the episode is discarded. Only a failed, reclaimed sweep gets the "M" mark.
Optionally, the sweep can be required to also trade through a confirmed swing high or swing low — an actual resting-liquidity level — rather than merely poking past the box edge. This is the strictest available definition of a stop hunt in the script: it rejects pierces of an arbitrary boundary that collected no stops, at the cost of far fewer episodes.
3. Distribution ("D" label, teal for up / red for down): after the failed sweep, the script watches a limited window of bars for confirmation in the opposite direction. By default this confirmation is a structure break, measured against the rolling structure extreme in the 2 × Swing Length bars ending with the sweep. A close beyond that extreme means the sweeping move has been undone. You can switch the confirmation to a close beyond the range midpoint, or beyond the opposite edge of the range (strictest — this requires price to cross the whole range). If price instead takes out the manipulation extreme, or the window runs out, the episode is discarded as failed.
4. Liquidity pools (thin red and teal lines): independently of the phase episodes, the script draws a horizontal line at every confirmed swing high (red, above price) and swing low (teal, below price) — the classic levels where resting stop-loss orders accumulate. Each line stops extending the moment price trades through it, so untapped liquidity stays visible while collected liquidity visibly ends. These lines give context to the phases: sweeps and structure breaks usually happen exactly at them. The levels are tracked internally whether or not the lines are displayed.
Everything is evaluated on closed bars only, so labels and boxes do not repaint: once a phase is marked, it stays where it was marked. Only the panel's WINDOW countdown and the current price levels update as new bars close.
🔶ORIGINALITY
This is not a generic session box or a sweep marker. It uses one closed-bar state machine that requires all three phases to occur in order: a compressed range, a reclaimed sweep beyond that range, and a separately confirmed move away from the swept side. The panel makes the state of that sequence visible before it completes, including its exact confirmation and failure conditions.
The script also keeps failed episodes visible by default and counts them alongside completed ones. That makes the chart show the full record of the model on loaded history, rather than only its completed examples. The Follow-Through table is a separate measurement layer: it evaluates what happened after confirmed sequences using levels derived from each sequence itself.
🔶THE FOLLOW-THROUGH TABLE — WHAT HAPPENED AFTER THE PATTERN COMPLETED
Completing a pattern and going somewhere afterwards are two different things, so the script measures the second one separately and shows the count in its own small table.
Every level in that measurement comes from the pattern itself, not from a setting you have to guess:
- The reference price is the closing price of the confirmation bar — the bar that produced the "D".
- The risk unit is the distance from that price back to the manipulation extreme, the tip of the sweep. That is the level the model itself treats as invalidation, so it defines one unit of risk.
- The objective is that same distance multiplied by the "Risk / Reward (RR)" setting, in the confirmed direction.
Starting with the first completed bar after confirmation, the script follows price until one of two things happens first: the objective is reached, or price returns to the manipulation extreme. The table reports REACHED, INVALIDATED, UNRESOLVED (still running) and the resulting RATE, for example 20/35 (57%).
At the moment of each confirmation the objective level is also drawn on the chart as a short horizontal line, tagged with the R multiple you chose (1R, 2R, and so on). It is the exact level the table measures against, placed there so you can see where the measurement is taken. It is a marker of the measurement, not a take-profit order and not a recommendation to trade to it — the same caution the whole table carries applies to the line.
The RATE is coloured against the indifference line for the objective you chose, which is 100 / (1 + objective) percent — 50% at a 1.0 objective, 33% at 2.0, 25% at 3.0. That is simply the rate at which the two outcomes cancel each other out arithmetically, before any trading costs. The colour marks which side of that line this particular history fell on; it does not mean the pattern is or is not profitable, because commissions, spread and slippage appear nowhere in this table.
After confirmation, bars where price touched both levels are counted as INVALIDATED, because the order of events inside a single bar cannot be determined from this data. That is the conservative choice and it means the REACHED count is, if anything, understated. The confirmation bar itself establishes the reference price and is not evaluated as a follow-through outcome.
Read this table as a description of what this pattern did on the history your chart happens to have loaded, on the settings you happen to have chosen. It is not a backtest of a trading system: it contains no commission, no spread, no slippage, no position sizing and no partial exits. It is not a forecast. Change the symbol, the timeframe, the settings or the amount of history your plan loads and the number will change. If you find yourself adjusting settings until this number looks good, you are fitting the settings to the past, and the number stops telling you anything.
🔶HOW TO ACTUALLY USE IT (STEP BY STEP)
1. When a blue "A" box appears, price is compressing. The panel switches to ACCUMULATION and shows the two sweep trigger prices. Liquidity is building above and below that box.
2. When one of those trigger prices is reached, the panel switches to SWEEP HIGH or SWEEP LOW and starts a countdown. This is the moment the model is being tested: price must close back inside the range before the window runs out, or the episode is discarded as a real breakout.
3. When the orange "M" mark appears, the sweep was reclaimed. The panel now shows the confirmation level for distribution and a fresh countdown. The failed breakout side tells you which resting stops were just collected.
4. When the "D" mark appears, price has confirmed movement away from the swept side (teal "D" = confirmed up after a sweep of the lows, red "D" = confirmed down after a sweep of the highs). The three-phase sequence is complete.
5. Check the EPISODES row before you trust the pattern on a new symbol or timeframe. If the completion percentage on your instrument is low, the model is simply not describing that market well — the panel tells you that honestly instead of hiding it.
6. Combine the phase marks with your own analysis (trend, higher-timeframe levels, session times). The indicator describes structure and reports the state of a model; it does not predict price.
🔶EVERY SETTING EXPLAINED
🔹Accumulation group
- ATR Length — the length of the volatility measure that scales every threshold in the script. Larger = slower to adapt to volatility changes.
- Range Window (bars) — how many recent bars are checked for compression. Larger windows find bigger, slower ranges.
- Max Range Height (x ATR) — how tight the window must be to count as accumulation. Lower = stricter and rarer ranges, higher = looser and more frequent.
- Min Range Age (bars) — how many consecutive closed bars the compression must hold before the range qualifies. Filters out one-bar pauses.
- Episode Cooldown (bars) — how many bars must pass after an episode ends before a new range may qualify. Prevents overlapping back-to-back boxes over the same congestion area.
🔹Manipulation group
- Min Sweep Depth (x ATR) — how far beyond the range edge the wick must reach to count as a sweep. Raise it to ignore shallow pokes; set to 0 to accept any pierce.
- Reclaim Window (bars) — how quickly price must close back inside the range after the sweep. Short = only sharp stop-hunts count; longer = slower fake-outs also count.
- Allow Closes Beyond The Edge — ON (default) tolerates closes outside the swept edge as long as price returns within the reclaim window, so deeper stop-hunts also count. OFF is the strictest definition of a fake-out: any close beyond the swept edge cancels the episode (wicks only).
- Sweep Must Take Out A Liquidity Pool — OFF (default) accepts any sufficiently deep pierce of the range edge. ON additionally requires the same bar to trade through a confirmed swing high or low, so only sweeps that actually reached resting liquidity start a manipulation phase. Expect far fewer episodes with this on.
🔹Distribution group
- Confirmation Level — what counts as the real move: a close beyond the origin of the sweeping leg (Structure Break, default), beyond the range midpoint, or beyond the OPPOSITE edge of the range (strictest, requires crossing the entire range).
- Confirmation Window (bars) — how long after the reclaim the confirmation may arrive before the episode is discarded. Shorter windows produce fewer completed sequences.
🔹Follow-Through group
- Show Follow-Through Table — toggles the outcome table described above.
- Risk / Reward (RR) — how far price must travel in the confirmed direction, as a multiple of the distance from the confirmation close back to the manipulation extreme. Raising it makes the objective harder to reach. This same multiple also sets where the objective line is drawn and what its tag reads.
- Draw Objective Line On Chart — after each distribution, draws a short horizontal line at the measured objective, tagged with the R multiple. It marks the level the table measures against; it is not an order recommendation. Turn it off to keep the chart clean and rely on the table alone.
- Objective Line Length (bars) — how far to the right the objective line and its tag extend.
- Objective Line — the color of that line and tag.
- Position — placement of the table.
🔹Liquidity Pools group
- Show Pool Lines — toggles the swing high/low liquidity lines. Detection is unaffected; the levels are always tracked.
- Swing Length (bars) — how dominant a high/low must be (highest/lowest among this many bars on both sides) to count as a swing pivot. Larger = fewer, more significant pivots. This setting also feeds the Structure Break confirmation and the liquidity-pool sweep filter.
- Max Pool Lines Per Side — how many pool lines are kept before the oldest are removed.
- Highs / Lows — the two line colors.
🔹Display group
- Show Phase Boxes / Show A / M / D Labels — toggle the drawing layers separately.
- Keep Failed Episodes (dimmed) — keep discarded episodes on the chart, dimmed and dashed, for honest review; or remove them instantly.
- Max Episodes On Chart — how many past episodes stay on the chart before the oldest drawings are cleaned up.
- Colors — accumulation, manipulation, distribution up and distribution down colors.
🔹Panel group
- Show Live Phase Panel — toggles the panel described above.
- Position / Text Size / Dark Theme — placement and styling of the panel.
🔹Alerts group
- Accumulation Formed, Range Edge Swept (unconfirmed), Manipulation Confirmed, Distribution Confirmed, Episode Failed — enable the events you care about, then create ONE alert on this indicator and pick "Any alert() function call" in the TradingView alert window. Messages include the symbol, timeframe and the relevant price levels. The "Range Edge Swept" alert fires on an unconfirmed sweep, before the reclaim — it is an early heads-up, not a confirmation, and it will often be followed by a failed episode.
🔶LIMITATIONS AND WHAT THIS TOOL DELIBERATELY DOES NOT DO
No buy or sell signals, no entry orders, no stop-loss levels, no probability or confidence score. The objective line the script draws is the level the Follow-Through table measures against, tagged with the R multiple — it is a measurement marker, not a take-profit recommendation. Detecting a structural pattern is not the same as having a tradable edge, and presenting pattern marks as trade signals would overstate what any indicator of this kind can honestly claim.
The two counters report different things and neither is a trading result. EPISODES measures pattern completion — how often the A-M-D sequence finished at all. FOLLOW-THROUGH measures what price did after it finished, against a distance derived from the pattern. Both are computed only on the bars currently loaded in your chart, both ignore trading costs entirely, and both will change with your symbol, timeframe, settings and the amount of history your plan loads. Neither number is a claim about future performance, and no result from either counter is implied or promised anywhere in this description.
The panel's NEXT and LEVEL rows state the conditions defined by the model, not a forecast. A sequence that reaches manipulation frequently fails before distribution, and a completed sequence is not a prediction that the move will continue.
Ranges, sweeps and structure breaks all depend on the settings you choose; different parameters produce different episodes on the same chart. Treat the defaults as a starting point and check the EPISODES row when you change them.
This tool is for analysis and education. It is not financial advice. Always do your own analysis and manage your own risk.

免責聲明
這些資訊和出版物並非旨在提供,也不構成TradingView提供或認可的任何形式的財務、投資、交易或其他類型的建議或推薦。請閱讀使用條款以了解更多資訊。
免責聲明
這些資訊和出版物並非旨在提供,也不構成TradingView提供或認可的任何形式的財務、投資、交易或其他類型的建議或推薦。請閱讀使用條款以了解更多資訊。